
Catalyst Handling Services Market Size, Share Global Analysis Report, 2024-2032
REPORT DETAILS
REPORT DETAILS
ABOUT THIS REPORT
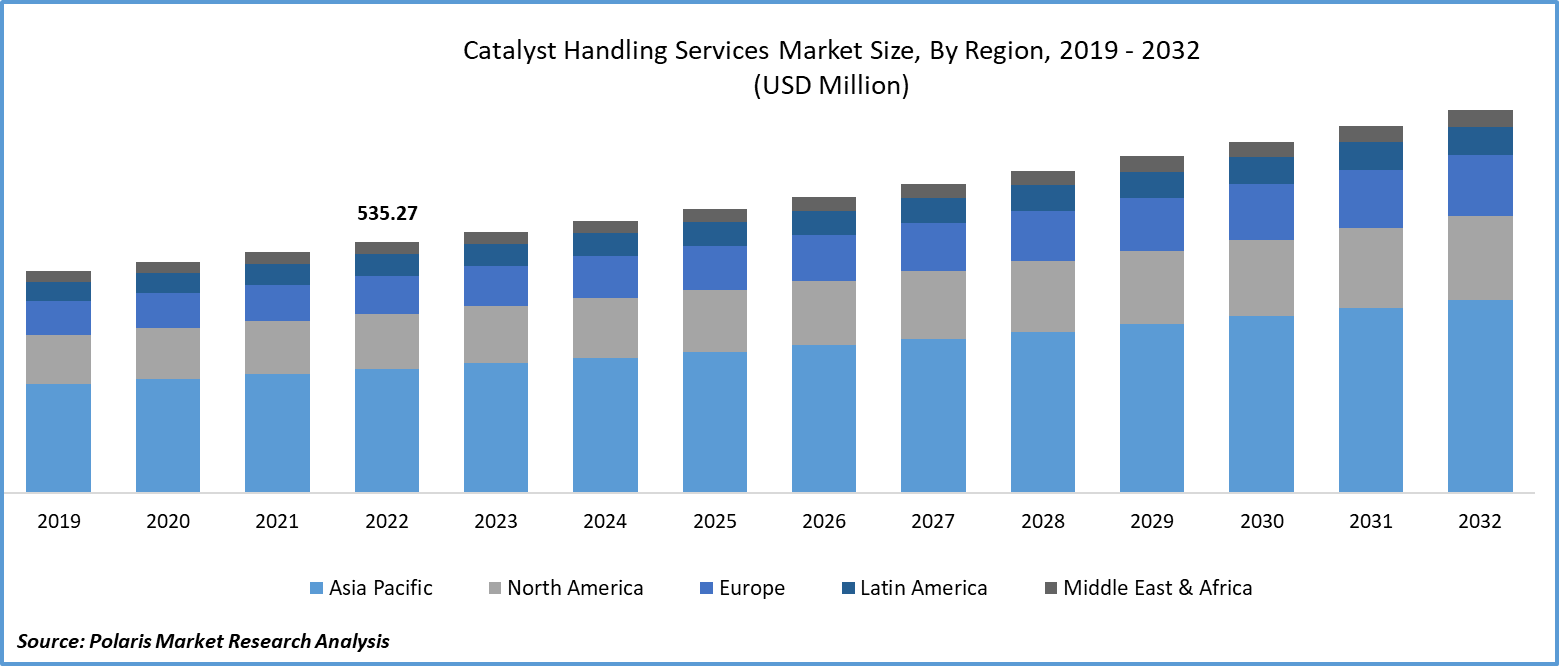
The global catalyst handling services market was valued at USD 557.7 million in 2023 and is expected to grow at a CAGR of 4.40% during the forecast period.
A catalyst is a substance that speeds up a reaction without consuming itself. Enzymes, which are organic compounds that occur naturally, catalyze numerous important metabolic processes. The important task of charging and discharging reactors necessitates the highest standards of efficiency and safety. Effective catalyst handling services save time and money by increasing the productivity of the plant. The rising product innovations by companies are driving the expansion of catalysts, fueling the demand for catalyst-handling services.
To Understand More About this Research: Download Sample Report
- For instance, in April 2023, Clariant announced the opening of a new, high-tech plant in order to produce CATOFIN, a high-yield, incredibly reliable propane dehydrogenation (PDH) catalyst.
Moreover, rising environmental regulations are enhancing the demand for catalysts, as they are widely used in vehicles as catalytic converters to control emissions. Catalyst handling services assist industrials by maintaining and effectively handling catalysts in the production process.
However, the decreasing industrial activity in the marketplace, driven by the COVID-19 pandemic, hampered the demand for petrochemical, oil and gas, and automobile industries by consumers due to the prevalence of stringent government regulations, primarily lockdown to control the widespread spread of the virus. Conversely, it affected production activities, lowered the demand for catalysts, and, in turn, decreased the demand for catalyst handling services.
The research study provides a comprehensive analysis of the industry, assessing the market on the basis of various segments and sub-segments. It sheds light on the competitive landscape and introduces Catalyst Handling Services Market key players from the perspective of market share, concentration ratio, etc. The study is a vital resource for understanding the growth drivers, opportunities, and challenges in the industry.
Growth Drivers
- The rising catalyst usage in various industries
Catalysts play a crucial role in the chemical industry as they can help conserve a significant amount of energy by speeding up chemical reactions without consuming energy themselves. Moreover, they allow scientists to control the chemical reaction and reduce the production of undesirable by-products, thereby minimizing waste. The catalysts are typically reusable, making them a cost-effective option for chemical industries. The growing use of catalysts in various industries has led to an increased demand for catalyst handling services.
In the oil refining sector, solid catalytic materials are of utmost importance. While there are several types of catalysts in use, the three primary ones are hydro-processing catalysts, fluid catalytic cracking catalysts (FCC), and reforming catalysts. During the process, catalysts get contaminated with impurities such as coke, sulfur, vanadium, and nickel, which gradually reduces their effectiveness. Diesel hydrodesulphurization catalysts usually last for three to four years, while FCC catalysts lose sulfur to the atmosphere daily and require replacement every two to four weeks, depending on their activity. This need for catalyst replacement has driven the demand for catalyst handling services.
Report Segmentation
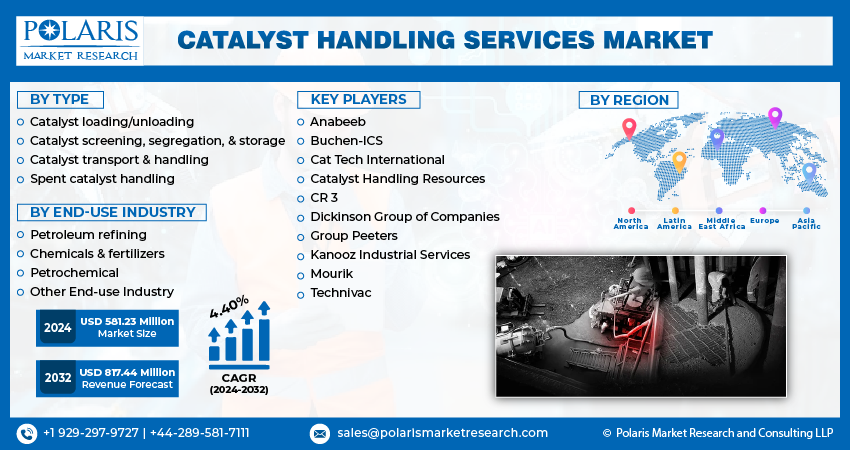
The market is primarily segmented based on type, end-use industry and region.
| By Type | By End-Use Industry | By Region |
|
|
|
To Understand the Scope of this Report: Request Customization
By Type Analysis
- Catalyst loading/unloading segment is expected to witness the highest growth during the forecast period
The catalyst loading and unloading segment is expected to grow at a steady rate during the projected period, driven by its wide range of applications in the industrial sector. Catalysts have a shorter lifespan, and are often replaced by catalyst handling services for loading and unloading purposes. Petrochemical industries are focused on maximizing production activity without interruptions, which requires speedy replacements of catalysts to keep the production process running smoothly. This demand for catalyst handling services is expected to rise in the next few years.
The spent catalyst handling segment accounted for a significant revenue share in 2022, mainly due to companies' increasing interest in reducing waste generation from industrial activity. After their life cycle, catalysts become hazardous materials due to various chemical reactions. To address this issue, companies are working on regenerating and recycling spent catalysts, instead of disposing of them in landfills, to comply with government regulations. This is driving the need for efficient catalyst-handling services.
By End-Use Industry Analysis
- Petrochemical segment accounted for the largest market share in 2022
The petrochemical industry holds the largest market share due to the increasing demand for petrochemical products in various sectors like packaging, medical equipment, tires, and plastic manufacturing. This demand is driving the growth of the industry at the global level, and creating new growth opportunities for catalyst handling services, which play a crucial role in the production processes. The widespread use of catalyst regeneration process among industries to minimize waste and maximize use in the petrochemical industry is further boosting the demand for catalyst handling services.
The petroleum refining sector is expected to grow at a faster pace in the coming years due to the global demand for petroleum products. This demand is driven by the growing research activities in petroleum applications for various product formulations, which is leading to increased production of petroleum by countries. To meet the ongoing consumer demand for petroleum, petroleum refineries will need to increase their production and utilize catalysts for an effective production process, which will create more opportunities for catalyst handling services in the future.
Regional Insights
- Asia Pacific region registered the global market in 2022
The Asia Pacific region has the largest catalyst handling services market share for catalyst handling services due to the prevalence of developing countries in this region. These countries have a growing manufacturing and petrochemical industry, which is driving the demand for catalyst-handling services. At the Petrochemical Industry Conference 2023, the Oil Ministry of India discussed the progress of the petrochemical industry in the country. It is anticipated that India's demand for chemicals and petrochemicals will almost triple and reach USD 1 trillion by 2040.
There is a potential investment opportunity worth USD 30 billion in the petrochemical industry in India within the next ten years. This is due to government flagship initiatives like "Make in India" and "Atma Nirbhar Bharat" that are collectively stimulating the industry's expansion. With growing investments in the industry, the production of petrochemicals is also increasing, which enhances the need for catalyst handling services in the long run.
Furthermore, the Indian government is proactively addressing current issues and making major efforts to improve the sector's overall competitiveness, quality, and output. This may create new growth potential for catalyst handling services.
Europe is expected to experience a significant growth due to the increase in oil and gas refinery activities in Turkey and Western Europe. These two regions are responsible for 17% of the world's oil and gas refining capacity. With the rising demand for gasoline and petroleum for transportation, countries are looking to increase their production of oil and gas. As a result, companies will need to continue chemical reactions to meet this demand, leading to an increased need for catalysts. Catalysts enhance the reaction process and reduce downtime. This will require the use of catalyst-handling services in the coming years, which are effective in handling and replacing spent catalysts.
Key Market Players & Competitive Insights
The catalyst handling services market is witnessing a rapid increase in competition due to rising company expansion with new product launches, partnerships, collaborations, mergers, and acquisitions. This ongoing trend is expanding the presence of global market players and fueling the availability of products to a larger consumer base.
Some of the major players operating in the global market include:
- Anabeeb
- Buchen-ICS
- Cat Tech International
- Catalyst Handling Resources
- CR 3
- Dickinson Group of Companies
- Group Peeters
- Kanooz Industrial Services
- Mourik
- Technivac
Recent Developments
- In July 2023, BASF established a new division for its businesses providing services for precious metals and emissions catalysts. It specialised in the manufacturing of mobile emission catalysts for petrol, diesel, and off-road vehicles, motorbikes, and small engines.
Catalyst Handling Services Market Report Scope
| Report Attributes | Details |
| Market size value in 2024 | USD 581.23 million |
| Revenue forecast in 2032 | USD 817.44 million |
| CAGR | 4.40% from 2024 – 2032 |
| Base year | 2023 |
| Historical data | 2019 – 2022 |
| Forecast period | 2024 – 2032 |
| Quantitative units | Revenue in USD million and CAGR from 2024 to 2032 |
| Segments covered | By Type, By End-Use Industry, By Region |
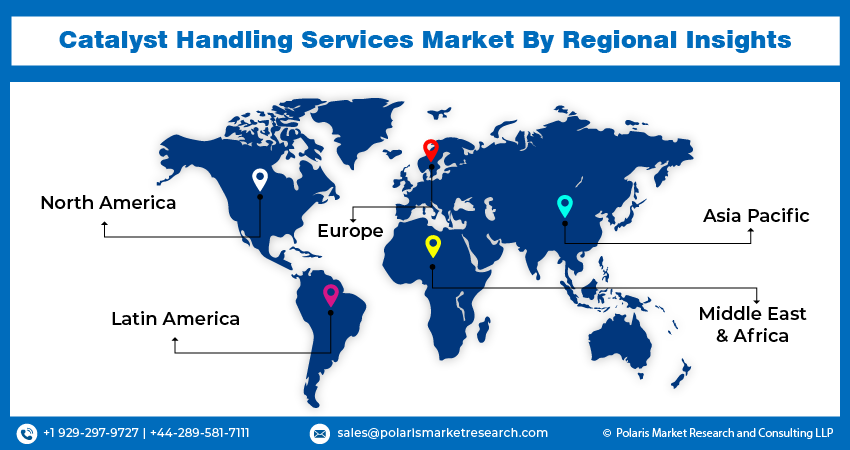
| Regional scope | North America, Europe, Asia Pacific, Latin America, Middle East & Africa |
| Customization | Report customization as per your requirements with respect to countries, region and segmentation. |
Gain profound insights into the 2024 Catalyst Handling Services Market with meticulously compiled statistics on market share, size, and revenue growth rate by Polaris Market Research Industry Reports. This thorough analysis not only provides a glimpse into historical trends but also unfolds a roadmap with a market forecast extending to 2032. Immerse yourself in the comprehensive nature of this industry analysis through a complimentary Download Sample Report.
Browse Our Top Selling Reports
North America Sugar Confectionery Market Size, Share 2024 Research Report
Contract Research Organization (CROs) Services Market Size, Share 2024 Research Report
Video Streaming Market Size, Share 2024 Research Report
Plate & Frame Heat Exchangers Market Size, Share 2024 Research Report
Research Methodology
A robust system of research, verification, and forecasting designed to ensure reliable and actionable market insights.
Polaris Market Research & Consulting, Inc. uses a clear and structured approach to deliver insights that clients can rely on. The process combines detailed primary and secondary research, including direct communication with industry experts. The detailed information helps build a complete picture of market trends and developments. Secondary data is gathered from credible sources such as industry reports, company filings, government source links, and trusted organization databases. It is then cross-checked through discussions with key stakeholders across the value chain. Market size and forecasts are developed using both bottom-up and top-down methods to ensure accuracy and consistency in the final results.
1. Project Setup
Step 1 & 2:
- We start every project by clearly understanding the client’s objective or goal, then defining the market scope, and aligning regions, segments, and timelines.
- Once the foundation is set, we collect data from all-around of sources, including company reports, government databases, and paid industry platforms.
- Our research is based on secondary data, which helps us build a strong understanding of the market across regions and industries. Then we validate this information through primary research by speaking directly with industry experts, companies, and stakeholders.
- By combining secondary and primary research, we ensure that our market insights are accurate, practical, and closely aligned with real market conditions.
2. Data Collection
We gather information from both public and verified sources:
3. Data Structuring
Step 3:
- All collected data is organized into a consistent format to ensure accurate analysis. Since inputs come from multiple sources, they are standardized and aligned before use.
- The data is segmented by product, application, and region, and mapped across a defined historical period (2020–2024). All values are converted into common units (USD Mn/Bn), and volume and pricing are aligned where required to estimate revenue.
- Any overlaps or inconsistencies are reviewed and adjusted to maintain accuracy (<5% variance threshold).
- The result is a structured dataset that allows for clear comparison across regions and supports reliable analysis and forecasting.
Structured Market Dataset, USD Mn/Bn
| Region | Segment | VolumeUnits | Avg PriceUSD | RevenueUSD Mn | Share % |
|---|---|---|---|---|---|
| North America | Product A | 250 | 2.5 | 500 | 15% |
| Product A | XX | XX | XX | XX | |
| Product A | XX | XX | XX | XX | |
| Consistent methodology applied across regions | |||||
4. Market Estimation
Step 4: TOP-DOWN APPROACH
- We start with the overall market size at a global or macro level.
- The market is then narrowed down based on scope and industry relevance.
- We apply penetration rates and split the data by region and segment.
- This helps us estimate the market size for specific segments.
- The numbers are validated through cross-checks to ensure accuracy.
Step 5: BOTTOM-UP APPROACH
- We begin by analyzing data from leading companies in the market.
- Revenue data is collected and mapped across different segments.
- The data is then aggregated to estimate the total market size.
- To fill in any gaps, adjustments are made based on industry standards.
- Validation checks make sure that the results are correct.
5. Forecasting
Step 6:
At Polaris Market Research & Consulting, Inc., we employ a methodical forecasting strategy. This approach blends the analysis of historical data with real-time market validation. To forecast future trends with precision, we examine past patterns, pricing fluctuations, and the interplay of supply and demand. To ensure our conclusions reflect the present market landscape, we actively seek input from industry experts and key stakeholders.
To refine our predictions, we carefully consider critical elements such as market drivers and restraints, fluctuations in raw material costs, emerging technologies, and the production capabilities of various regions. Furthermore, we assess regulatory frameworks and potential policy shifts to gauge their potential impact on market expansion.
All this information is synthesized to generate precise forecasts for each segment and region. These forecasts illuminate the current state of the market and highlight forthcoming opportunities.
6. Validation & Triangulation
Step 7:
In the final stage, we validate all our estimates using a triangulation method, where data is cross-checked from multiple reliable sources, like company data, primary interviews, and secondary research. This helps us make sure that our numbers are correct and fit with the rest of the market.
This process involves verifying data consistency across various segments and geographic areas. It also requires comparing historical trends with the assumptions support the forecast. Any discrepancies involve adjustments to ensure everything remains aligned and dependable.
Once the data is finalized, we prepare the final outputs, including market size estimates, segment-wise breakdowns, and growth metrics. These are delivered in structured formats such as tables, charts, and data files for easy analysis and use.
We collaborate closely with clients, ensuring the final products align with their requirements. This includes offering tailored adjustments, supplementary data analyses, and continuous assistance. Furthermore, we monitor market trends post-delivery, providing updates and refinements to maintain the insights' relevance as time passes.
Triangulation Framework
Estimates are cross-verified across three sources:
Company-level data
• Primary inputs from industry participants
• Secondary benchmarks and published data
Variance maintained within +5-10%
Adjustments applied to align estimates
Segment values validated against overall market structure
Data Consistency & Integrity
Segment totals validated to 100%
Regional estimates aligned with global market size
Historical trends compared against forecast outputs
Assumptions reviewed for cross-segment and regional alignment
Final Outputs
Deliverables
Client Alignment & Support
- Deliverables are aligned with defined client requirements and scope
- Custom data cuts and segment splits are incorporated as required
- Post-delivery queries are addressed through analyst interactions
- Additional clarifications and data support are provided upon request
Client Continuity & Updates
- Market developments are tracked post-delivery to capture changes in key trends
- Updated data and revisions are provided based on new market inputs
- Additional refinements and data cuts are shared as required
- Continued analyst engagement supports evolving client requirements
Download Sample Report of Catalyst Handling Services Market
Please fill out the form to request a customized copy of the research report.
