
Graph Database Market Share, Size, Trends, Industry Analysis Report, 2026 - 2034
REPORT DETAILS
Graph Database Market Summary
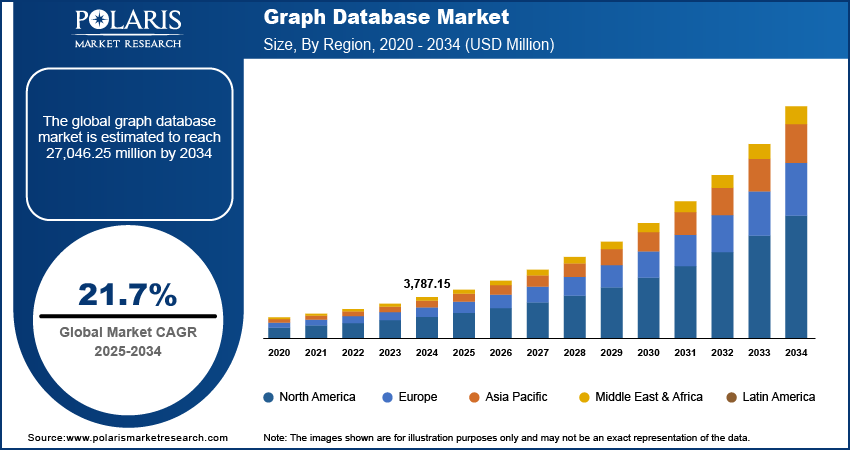
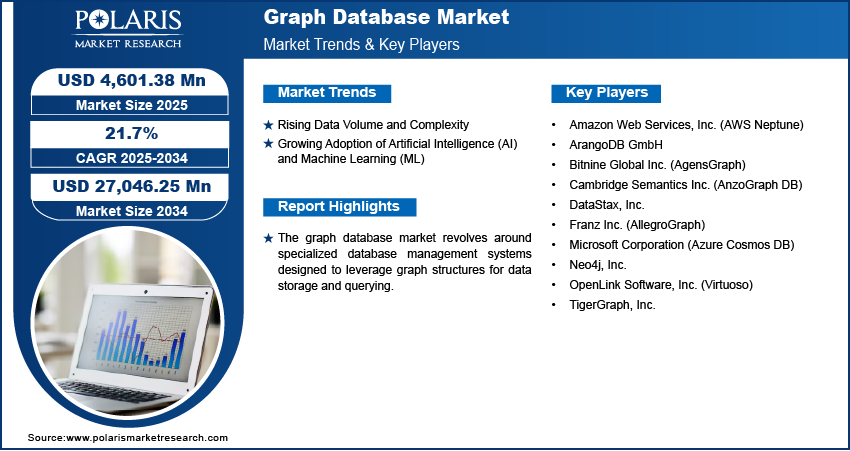
The graph database market size was valued at USD 4,601.38 million in 2025. The market is projected to exhibit a CAGR of 21.7% from 2026 to 2034. The rising demand for real-time big data digital mining and visualization is a significant market growth factor, as graph databases excel in providing insights from connected data with speed and accuracy.
Market Statistics
Key Takeaways
- North America led the global market with a 33.10% revenue share in 2025. This is owing to the early adoption of advanced technologies in the region.
- Asia Pacific is projected to witness rapid growth at a 22.5% CAGR. Increasing digitalization across various economies in the Asia Pacific drives the regional market growth.
- The solutions segment held the largest share of 60.22% in 2025. This dominance is attributed to the fundamental need for graph database software and platforms among organizations.
- The non-relational segment is expected to register a higher growth rate of 25.1% CAGR. Increasing recognition of the limitations of traditional relational databases contributes to the segment's market growth.
- The data management & analysis segment dominated with a 45.40% share in 2025. Companies across various sectors are using graph databases to improve data integration and knowledge graph construction.
Note: Figures and projections outlined in this report are the result of Polaris Market Research’s proprietary analytical processes, grounded in the latest available datasets and market observations.
Industry Dynamics
- Rising data volume and capacity have created the need for graph databases to manage and query highly interconnected datasets efficiently.
- The growing need for real-time big data mining and visualization is another factor driving market demand.
- The shift toward cloud-based graph databases is creating several market opportunities.
- Shortage of skilled professionals may present market challenges.
AI Impact on Graph Database Market
- The application of artificial intelligence makes graph databases work much better when processing intricate interconnections within information.
- It makes it possible to perform a better analysis of information by discovering the connections and patterns between large amounts of data.
- Artificial intelligence contributes to improving recommendation engines, fraud detection, and networking analysis because of faster insights into information.
- It enables automating information sorting and querying.
The graph database market is defined by its unique ability to model and query relationships between data points, offering a significant advantage over traditional relational databases when dealing with highly connected data. Instead of tables, graph databases use nodes to represent entities and edges to represent the connections between them. This structure allows for efficient traversal and analysis of complex relationships, making it ideal for applications where understanding the connections is as important as the data itself. The increasing volume and complexity of data across various industries are key factors driving the adoption of graph database technology. Businesses are recognizing the limitations of traditional databases in handling intricate data relationships and are turning to graph databases for enhanced data modeling and faster query performance on interconnected datasets.
Source: Polaris Market Research Analysis
To Understand More About this Research: Download Sample Report
The growing adoption of artificial intelligence (AI) and machine learning (ML) solutions fuels demand for graph database technology, as graph databases enable more accurate analysis of interconnected data, uncovering hidden patterns that traditional systems might miss. Furthermore, the increasing need for solutions that can process low-latency queries and the rapid use of virtualization for big data analytics are contributing to the positive market outlook for graph databases. The ability of graph databases to support semantic search across unstructured content and facilitate data unification further enhances their market potential across diverse applications.
Graph Databases vs Relational Databases
| Criteria | Graph Database | Relational Database |
| Structure | Data nodes and their relationships | Two-dimensional tables and records |
| Efficiency of Relationship Queries | Extremely efficient | Complex joins required) |
| Scalability | Adaptable to interconnected data | Well-suited for structured data |
| Query Processing | Faster processing for relationship queries | Slower processing for relationship queries |
| Analytic Functionality | Insights into contextual relationships | Minimal capabilities for relationship queries |
| Schema Flexibility | Extremely flexible | Rigid schema structure |
Source: Polaris Market Research Analysis
Market Dynamics
Rising Data Volume and Complexity
Traditional relational databases often struggle to manage and query highly interconnected datasets efficiently. Graph databases, with their ability to model relationships as first-class entities, offer a more natural and efficient way to handle such complexity. According to the US Bureau of Labor Statistics' Digital Economy Report 2023, the digital economy accounted for 10.2% of the US GDP between 2017 and 2022, rising at an annual rate of 6.8%. This surge in digital activity inherently leads to the creation of vast amounts of interconnected data, ranging from social networks and customer interactions to supply chains and knowledge graphs. The International Data Corporation (IDC) forecasts that the global datasphere will reach 175 zettabytes by 2025, highlighting the sheer volume of data being generated that necessitates more scalable and flexible master data management solutions. The ability of graph databases to navigate and analyze these intricate relationships in real-time provides businesses with crucial market insights. Therefore, escalating volume and complexity of data being generated across various sectors are propelling the adoption of graph database technology.
Growing Adoption of Artificial Intelligence (AI) and Machine Learning (ML)
AI and ML algorithms often rely on understanding the relationships within data to derive meaningful insights and make accurate predictions. Graph databases excel at representing and querying these relationships, making them a powerful tool for enhancing AI/ML applications such as recommendation engines, fraud detection, and knowledge discovery. In May 2022, International Business Machines Corporation (IBM), a US-based company, reported that 35% of businesses worldwide utilized artificial intelligence in 2022, marking a 4% increase from 2021. Furthermore, the number of organizations adopting AI rose by 13% in 2022 compared to the previous year. This growing adoption of AI and ML, which benefit significantly from the relational modeling capabilities of graph databases, is a key factor fueling the growth of the market for graph database.
Increasing Need for Real-Time Big Data Mining and Visualization
In fast-paced business environment, organizations need to quickly extract insights from massive datasets to make timely decisions. Graph databases are designed to efficiently query and analyze interconnected data in real-time, providing a significant advantage over traditional databases for applications such as fraud detection, network monitoring, and personalized recommendations. Dataversity and Datanami, emphasize the growing demand for real-time insights from large datasets to support timely decision-making in various industries. The increasing need to incorporate real-time big data mining with visualization of results, a capability where graph databases offer superior performance, are significantly contributing to the development of graph database technologies. Hence, the escalating demand for real-time analysis and visualization of big data is a significant growth factor for graph databases.
Use in Recommendation Engines and Personalization
Graph databases find extensive use in various personalized systems on e-commerce platforms, streaming platforms, and social networking sites. It enables real-time evaluation of connections among the customer, merchandise, videos, browsing patterns, purchase patterns, and social behavior. The technology is used in e-commerce sites to predict consumer behavior and recommend suitable merchandise based on the consumer’s preferences and buying behavior. Graph databases are also used in streaming platforms where movies, songs, and videos are recommended to the consumer based on their preferences. Social media sites could also benefit from graph databases through the improvement of content feeds and friendship recommendations.
Source: Polaris Market Research Analysis
Segment Insights
Market Assessment – By Component
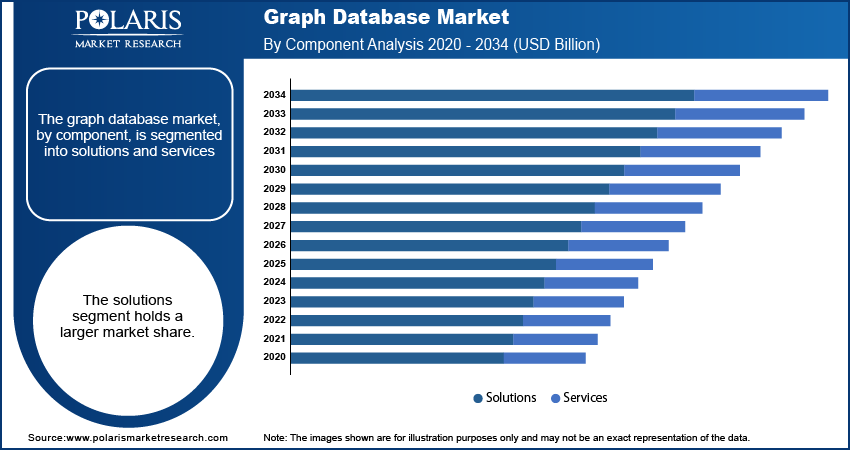
The graph database market, by component, is segmented into solutions and services. The solutions segment holds a larger share of 60.22% in 2025. This dominance is attributed to the fundamental need for graph database software and platforms that enable organizations to build and deploy applications leveraging connected data. The availability of diverse graph database solutions, offering varied features and functionalities to cater to different industry needs and use cases, contributes significantly to its leading position. The continuous development and innovation in graph database technologies further solidify the solutions segment's substantial market presence.
The services segment is anticipated to exhibit a higher growth rate during the forecast period. This rapid growth is driven by the increasing demand for expertise and assistance in implementing, managing, and optimizing graph database deployments. As the adoption of graph database technology expands across various industries, the need for specialized services such as consulting, implementation, training, and support becomes crucial. Organizations often require external expertise to effectively leverage the capabilities of graph databases and integrate them into their existing IT infrastructure, thus fueling the high growth trajectory of the services segment.
Market Evaluation – By Database Type
By database type, the graph database market is segmented into relational and non-relational. The non-relational segment accounts for hgiher share and higher growth rate of CAGR 25.1%. This substantial share is primarily attributed to the inherent nature of graph databases as a category of non-relational databases, specifically designed to handle complex relationships between data points. Their flexible schema and optimized architecture for traversing connections make them well-suited for applications dealing with highly interconnected data, leading to their widespread adoption and consequently, the dominant share within this segmentation.
While already holding the largest share, the non-relational segment is also expected to register a higher growth rate during the forecast period. This continued growth is fueled by the increasing recognition of the limitations of traditional relational databases in managing and analyzing interconnected data. As businesses grapple with more complex datasets and the need for real-time insights from these relationships, the demand for non-relational graph database solutions is projected to increase steadily. The trend for purpose-built graph databases to address specific data relationship challenges would contribute to the anticipated highest growth rate within the non-relational segment in the coming years.
Market Assessment – By Application
The graph database market, by application, is segmented into fraud detection, data management & analysis, customer analysis, identity & access management, compliance & risk, and others. The data management & analysis segment holds the largest share of 45.40%. This significant share is attributed to the fundamental capability of graph databases to efficiently model, query, and analyze complex relationships within large datasets. Organizations across various industries are increasingly leveraging graph databases for enhanced data integration, knowledge graph construction, and gaining deeper market insights from their interconnected data, thereby establishing AI data management & analysis as the leading application area.
The fraud detection segment is anticipated to exhibit the highest growth rate during the forecast period. The ability of graph databases to identify intricate patterns and anomalies in interconnected data makes them exceptionally well-suited for detecting fraudulent activities. With the rising sophistication of fraud schemes across various sectors such as finance and e-commerce, the demand for advanced fraud detection solutions that can leverage relationship analysis is rapidly increasing. This growing need for effective tools to combat fraud by uncovering hidden connections and suspicious activities will fuel the growth rate of the fraud detection segment during the forecast period.
Market Assessment – By Deployment Mode
The graph database market, by deployment mode, is segmented into cloud and on-premises. The on-premises segment accounts for a larger share. This substantial share is primarily attributed to factors such as stringent data security requirements, the need for greater control over infrastructure, and compliance regulations in certain industries. Many organizations, particularly those handling sensitive data, have historically preferred to maintain their database systems within their own physical infrastructure, contributing to the dominance of the on-premises deployment mode.
The cloud segment is anticipated to exhibit the highest growth rate during the forecast period. The increasing adoption of cloud technologies across various industries, driven by factors such as scalability, cost-effectiveness, and ease of management, is fueling this rapid growth. The flexibility and agility offered by cloud-based graph database services are attracting a growing number of organizations, particularly smaller and medium-sized enterprises, as well as those seeking rapid deployment and reduced operational overhead. This increasing preference for cloud-based solutions will boost the growth rate of the cloud segment in the coming years.
Source: Polaris Market Research Analysis
Regional Analysis
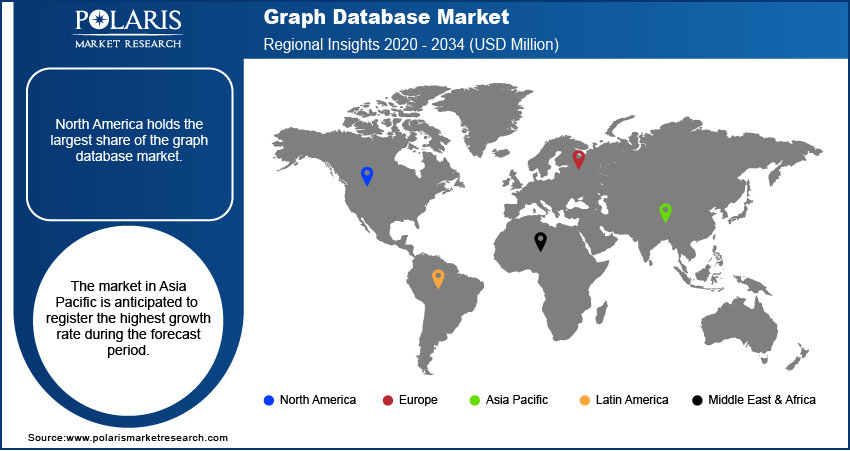
The market demonstrates a global presence, with key regions such as North America, Europe, Asia Pacific, Latin America, and the Middle East & Africa each contributing uniquely to the overall market dynamics. These regions exhibit varying levels of market penetration, influenced by factors such as technological adoption rates, the presence of key industry players, and the specific needs of businesses within each geography. Understanding the nuances of these regional markets is crucial for assessing the global market outlook and identifying potential entry opportunities.
North America holds the largest share of 33.10% in 2025. This significant share can be attributed to the early adoption of advanced technologies, a strong presence of leading technology providers, and substantial investments in research and development within the region. Furthermore, the high concentration of data-intensive industries and the increasing focus on leveraging data relationships for enhanced business intelligence across various sectors in North America contribute significantly to its leading position.
The Asia Pacific graph database market is anticipated to exhibit the highest growth rate of CAGR 22.5% during the forecast period. This rapid growth will be driven by factors such as the increasing digitalization across various economies in the region, the growing volume of data generated by a large and expanding internet user base, and the rising adoption of technologies such as AI and big data analytics. The increasing investments in IT infrastructure and the growing awareness of the benefits of graph databases in handling complex data relationships across industries in Asia Pacific are fueling this substantial demand trend.
Source: Polaris Market Research Analysis
Key Players and Competitive Insights
A few major players actively involved in the graph database market include Neo4j, Inc.; TigerGraph, Inc.; Cambridge Semantics Inc. (AnzoGraph DB); DataStax, Inc.; Franz Inc. (AllegroGraph); OpenLink Software, Inc. (Virtuoso); Bitnine Global Inc. (AgensGraph); ArangoDB GmbH; Amazon Web Services, Inc. (AWS Neptune); and Microsoft Corporation (Azure Cosmos DB). These entities offer various graph database solutions and services catering to diverse industry needs and applications.
The competitive analysis of the graph database market reveals a landscape characterized by established players and emerging innovators. Competition is driven by factors such as performance, scalability, data model flexibility (property graph, RDF), query language support (such as Cypher and SPARQL), integration capabilities with other technologies (AI/ML, cloud services), and the breadth of industry-specific solutions offered. Industry insights indicate a growing emphasis on ease of use, real-time analytics capabilities, and the integration of vector database search for enhanced AI applications. The focus on addressing complex data relationship challenges across various use cases intensifies the competition among these key players.
Neo4j, Inc., headquartered in San Mateo, California, US, provides a native graph database platform. Their offerings include Neo4j Graph Database, a robust solution for managing and querying connected data, and Neo4j AuraDB, a fully managed graph database service on the cloud. Neo4j's products are relevant to the market by enabling organizations to model complex relationships; perform real-time analysis; and build applications for use cases such as fraud detection, recommendation engines, and knowledge graphs.
TigerGraph, Inc., based in Redwood City, California, US, offers a parallel graph database platform designed for enterprise applications. Their key offerings include TigerGraph DB and TigerGraph Cloud, providing capabilities for real-time deep link analytics on large datasets. TigerGraph's solutions are pertinent to the graph database market by enabling use cases such as fraud prevention, customer 360 views, supply chain optimization, and knowledge graph development, particularly for applications requiring high-performance analytics on interconnected data.
List of Key Companies in Graph Database Market
- Amazon Web Services, Inc. (AWS Neptune)
- ArangoDB GmbH
- Bitnine Global Inc. (AgensGraph)
- Cambridge Semantics Inc. (AnzoGraph DB)
- DataStax, Inc.
- Franz Inc. (AllegroGraph)
- Microsoft Corporation (Azure Cosmos DB)
- Neo4j, Inc.
- OpenLink Software, Inc. (Virtuoso)
- TigerGraph, Inc.
Graph Database Industry Developments
- April 2026: Neo4j released Neo4j 2026.04.0. The new release introduced enhanced security features. They include the attribute-based access control (ABAC) capability that allows users to secure access to administrative or data capabilities with context-aware auth rules. (source: neo4j.com)
- February 2026: Amazon Neptune announced the availability of Neptune Analytics to 14 new regions. These include regions across Africa, the Asia Pacific, and Europe. (source: aws.amazon.com)
Graph Database Market Segmentation
By Component Outlook (Revenue – USD Million, 2021–2034)
- Solutions
- Services
By Database Type Outlook (Revenue – USD Million, 2021–2034)
- Relational
- Non-relational
By Application Outlook (Revenue – USD Million, 2021–2034)
- Fraud Detection
- Data Management & Analysis
- Customer Analysis
- Identity & Access Management
- Compliance & Risk
- Others
By Deployment Mode Outlook (Revenue – USD Million, 2021–2034)
- Cloud
- On-premises
By Regional Outlook (Revenue – USD Million, 2021–2034)
- North America
- US
- Canada
- Europe
- Germany
- France
- UK
- Italy
- Spain
- Netherlands
- Russia
- Rest of Europe
- Asia Pacific
- China
- Japan
- India
- Malaysia
- South Korea
- Indonesia
- Australia
- Vietnam
- Rest of Asia Pacific
- Middle East & Africa
- Saudi Arabia
- UAE
- Israel
- South Africa
- Rest of Middle East & Africa
- Latin America
- Mexico
- Brazil
- Argentina
- Rest of Latin America
Graph Database Market Report Scope
| Report Attributes | Details |
| Market Size Value in 2025 | USD 4,601.38 million |
| Market Size Value in 2026 | USD 5.405.21 million |
| Revenue Forecast by 2034 | USD 27,046.25 million |
| CAGR | 21.7% from 2026 to 2034 |
| Base Year | 2025 |
| Historical Data | 2021–2024 |
| Forecast Period | 2026–2034 |
| Quantitative Units | Revenue in USD million and CAGR from 2026 to 2034 |
| Report Coverage | Revenue Forecast, Competitive Landscape, Growth Factors, and Industry Insights |
| Segments Covered |
|
| Regional Scope |
|
| Competitive Landscape |
|
| Report Format |
|
| Customization | Report customization as per your requirements with respect to countries, regions, and segmentation. |
Source: Polaris Market Research Analysis
Graph Database Market FAQ's
The market size was valued at USD 4,601.38 million in 2025 and is projected to grow to USD 27,046.25 million by 2034.
The market is projected to register a CAGR of 21.7% during the forecast period.
North America held the largest share of 33.10% in 2025.
A few major players actively involved in the market include Neo4j, Inc.; TigerGraph, Inc.; Cambridge Semantics Inc. (AnzoGraph DB); DataStax, Inc.; Franz Inc. (AllegroGraph); OpenLink Software, Inc. (Virtuoso); Bitnine Global Inc. (AgensGraph); ArangoDB GmbH; Amazon Web Services, Inc. (AWS Neptune); and Microsoft Corporation (Azure Cosmos DB).
The solutions segment accounted for a larger share of 60.22% in 2025.
Following are a few of the market trends: ? Increasing Adoption of AI and ML: Graph databases are becoming increasingly crucial for analyzing interconnected data, enabling AI and ML models to uncover deeper relationships and hidden patterns for more accurate predictions and insights. ? Growing Demand for Real-Time Data Processing: The need for real-time analysis of large, interconnected datasets is rising, driving the adoption of graph databases for applications such as fraud detection and recommendation engines where timely insights are critical. ? Enhanced Analytics Capabilities: Graph databases are integrating advanced analytics tools to facilitate deeper data exploration and more sophisticated queries, allowing businesses to uncover hidden patterns and gain more informed strategies.
A graph database is a type of NoSQL database that uses graph structures with nodes, edges, and properties to represent and store data. Nodes represent entities (such as people, organizations, or accounts), and edges represent the relationships between these entities. Properties are used to store information associated with both nodes and edges.
Download Sample Report of Graph Database Market
Please fill out the form to request a customized copy of the research report.
