
Jerky Snacks Market Size & Share Global Analysis Report, 2023-2032
REPORT DETAILS
REPORT DETAILS
ABOUT THIS REPORT
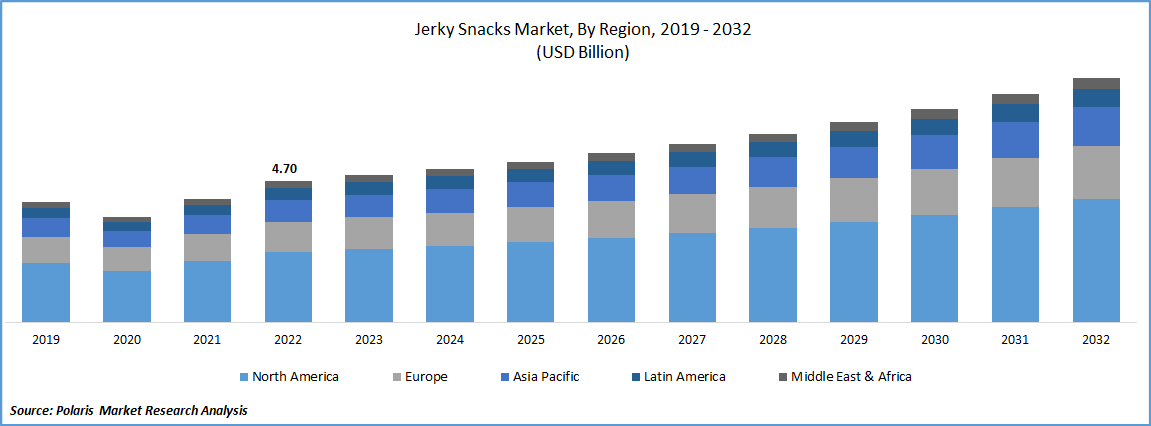
The global jerky snacks market was valued at USD 4.70 billion in 2022 and is expected to grow at a CAGR of 5.81% during the forecast period.
Improving industry participant’s contribution in the product development with various new technologies and flavours is majorly helping the market to grow globally. the development of new processing and packaging technologies has allowed to produce jerky snacks with longer shelf lives and improved quality. This has enabled manufacturers to produce and distribute jerky snacks to a wider range of consumers in various parts of the world. For instance, in April 2023, as part of its collaboration with Jack Link's, PepsiCo's Doritos brand will develop a new jerky product. Two flavours are available: Original beef jerky and meat sticks in the Flamin' Hot flavour and Jack Link's Doritos Spicy Sweet Chilli flavour. This is dramatically escalating the revenue of the global market.
To Understand More About this Research: Download Sample Report
Jerky snacks offer several potential benefits when consumed as part of a balanced diet. These are a good source of protein, which is essential for building and repairing tissues in the body. Snacks are a good source of several important nutrients, including iron, zinc, and vitamin B12. With the increasing popularity of vegan and plant-based diets, there is a growing demand for jerky snacks made from plant-based protein sources. These snacks offer a similar texture and flavour to traditional meat-based jerky but are suitable for those following a vegan or vegetarian lifestyle.
The pandemic has caused economic uncertainty, leading to some consumers being more cautious with their spending. This has led to some manufacturers experiencing a decrease in sales. The pandemic has disrupted supply chains, leading to shortages of some ingredients and packaging materials which have led to some manufacturers experiencing delays in production and shipping. However, consumers are turning to e-commerce to purchase their favourite snacks which resulted in significant increase in online sales of these snacks. As a result, increasing online sales has improved the global market’s growth.
Industry Dynamics
Growth Drivers
Augmenting the requirement for healthy protein based snacks and rising awareness regarding healthy lifestyle is one of the foremost factors fuelling the market’s growth. As people become more health-conscious and seek out healthier snack options, jerky snacks are emerging as a popular choice due to their high protein content and lower fat content compared to traditional snack foods. Consumers become more conscious of the source and quality of the food they consume. For example, total 6.8% of the US population involved in healthy lifestyle factors. In addition to this, more than half of Americans means almost 52% say they eat a healthy diet. Many jerky snacks are compatible with these diets as they are high in protein and low in carbohydrates, making them an ideal snack option for people following these dietary patterns. Henceforth, this factor is primarily heightening the growth of the jerky snacks market globally.
The growth of e-commerce and the widespread use of smartphones are further factors contributing to the market's progress. For example, almost 91% consumer makes online purchases with the help of their smartphone. These factors prompted many small and medium-sized businesses to create online platforms in order to increase their distribution options. Small businesses in particular have benefited from the online distribution channel for manufacturers. Businesses target millennial customers, one of the categories with the largest density, which results in a high level of product acceptance in the market.
Report Segmentation
The market is primarily segmented based product, distribution channel, and region.
| By Product | By Distribution Channel | By Region |
|
|
|
To Understand the Scope of this Report: Request Customization
Beef Segment Held Largest share in the Global Market in 2022
In fiscal year 2022, the beef segment dominates the market with major share as it is a widely available and popular meat that is consumed in many parts of the world. These snacks have a unique flavour and texture that appeal to many consumers. The dominance of beef jerky snacks in the jerky snacks market can be attributed to their unique taste and texture, long shelf life, convenience, and nutritional value, as well as the availability of a wide range of flavours and varieties.
To leverages the benefits of the beef jerky snacks, large number of businesses are largely contributing to the market. For example, in January 2022, Baja Vida, has been unveiled by the Baja Jerky. Likewise many other companies are also helping the market to grow and maintain its supremacy in the upcoming years.
Online Segment is the Fastest Growing Segment During the Forecast Period
Online segment is expected to expand at the fastest CAGR during the forecast period. The rise of e-commerce and online retail platforms has made it easier for consumers to purchase jerky snacks online. Consumers can now order jerky snacks from the comfort of their homes or on-the-go through their mobile devices. This convenience has contributed to the growth of the online segment. For example, in April 2022, the Certified Piedmontese store on Amazon, which sells the entire line of Grass Fed Grass Finished beef snacks produced by the company, has just been opened. Also, Jerky.com, People’s Choice Beef Jerky, Amazon, and Dickson’s Farmstand are some of the popular online sellers in the industry. Online retailers often offer fast and efficient delivery options, which another factor is contributing to the growth of the online segment.
North America is Accounting the Largest Share in the Global Market in 2022
In the fiscal year 2022, North America is expected to lead the global market with major share. US is a large market with a significant population and a high per capita income, which creates a large and affluent consumer base for jerky snacks. The US has a strong meat industry and a diverse range of meat products, including beef, pork, turkey, and chicken, which makes it easier for manufacturers to produce a wide range of jerky snack products.
This diversity also provides consumers with a variety of flavour and protein options to choose from. Escalating consumption of jerky snacks and products due to rising awareness regarding healthy lifestyle is one of the prominent factors driving the growth of market in the North America. For example, according to the US Census and NHCS, around 50% or over 160 million people of the total United States population eat beef jerky and meat snacks frequently. Subsequently, this factor is driving the growth of market in the region and is poised to maintain its dominance in the forthcoming years.
Asia Pacific is projected to grow at the fastest CAGR during the assessment period. Growing population is boosting demand for meat snacks across Asia Pacific, which is further boosting the sales of jerky snacks. China is the one of the largest consumer of meat market worldwide. The Chinese consumed nearly 100 million tons of meat in 2021 which is around 27 percent of the world's total consumption. With the growing demand for high-protein, low-fat foods, the consumption of meat food is steadily increasing in the region. Consumers who are looking for convenient, on-the-go snacks that are high in protein and low in carbohydrates have been driving the demand for jerky snacks. As a result, the market has been experiencing significant growth in the Asia Pacific.
Competitive Insight
Some of the major players operating in the global market include
- JACK LINK'S
- Oberto Snacks
- Hershey Company
- General Mills
- Frito-Lay
- Old Trapper Beef Jerky
- Chef's Cut Real Jerky
- Tillamook Country Smoker
- Conagra Brands
- Meatsnacks Group
Recent Developments
- In October 2024, at the 2024 NACS Tradeshow, Old Trapper showcased updated beef jerky packaging and flavor innovations, including redesigned gusseted bags for 15 oz beef sticks and popular flavors like teriyaki, addressing growing demand for convenience and variety.
- In September 2024, Jack Link’s introduced a limited-edition beef jerky flavor, Red Light Green Light, inspired by Netflix’s Squid Game. The product blends sweet and spicy Korean Ssamjang flavors with classic beef jerky to enhance the entertainment snacking experience.
- In August 2024, Tillamook Country Smoker launched Tajín® Flavored Beef Jerky, combining premium beef with bold, tangy seasoning. The product is available online via Amazon and the company website, emphasizing clean-label ingredients.
- In April 2023, Doki, a start-up company established in Delhi, sells meaty chips and jerky in a variety of regional and international flavours, such as teriyaki, gochujang, and smoky masala.
- In March 2022, Beyond Meat and PepsiCo introduced the first plant-based jerky through their joint venture, expanding plant-based snack options and targeting flexitarian consumers.
- In May 2021, Bai Capital acquired Valeo Foods Group, strengthening its presence in the European food market and supporting long-term growth.
Jerky Snacks Market Report Scope
| Report Attributes | Details |
| Market size value in 2023 | USD 4.89 billion |
| Revenue forecast in 2032 | USD 8.14 billion |
| CAGR | 5.81% from 2023 – 2032 |
| Base year | 2022 |
| Historical data | 2019– 2022 |
| Forecast period | 2023– 2032 |
| Quantitative units | Revenue in USD billion and CAGR from 2023 to 2032 |
| Segments covered | By Product, By Distribution Channel, By Region |
| Regional scope | North America, Europe, Asia Pacific, Latin America, Middle East & Africa |
| Key companies | JACK LINK'S, Oberto Snacks Inc., The Hershey Company, General Mills Inc, Frito-Lay North America, Inc., Old Trapper Beef Jerky, Chef's Cut Real Jerky, Tillamook Country Smoker, Conagra Brands, Inc., and The Meatsnacks Group |
FAQ's
The global jerky snacks market size is expected to reach USD 8.14 billion by 2032.
Key players in the jerky snacks market are JACK LINK'S, Oberto Snacks, Hershey Company, General Mills, Frito-Lay, Old Trapper Beef Jerky, Chef's Cut Real Jerky.
North America contribute notably towards the global jerky snacks market.
The global jerky snacks market is expected to grow at a CAGR of 5.81% during the forecast period.
The jerky snacks market report covering key segments are product, distribution channel, and region.
E-commerce is the fastest-growing distribution channel, driven by smartphone usage and platforms like Amazon and Jerky.com boosting online sales.
The beef segment dominates due to its unique taste, long shelf life, convenience, and wide variety of available flavors.
Research Methodology
A robust system of research, verification, and forecasting designed to ensure reliable and actionable market insights.
Polaris Market Research & Consulting, Inc. uses a clear and structured approach to deliver insights that clients can rely on. The process combines detailed primary and secondary research, including direct communication with industry experts. The detailed information helps build a complete picture of market trends and developments. Secondary data is gathered from credible sources such as industry reports, company filings, government source links, and trusted organization databases. It is then cross-checked through discussions with key stakeholders across the value chain. Market size and forecasts are developed using both bottom-up and top-down methods to ensure accuracy and consistency in the final results.
1. Project Setup
Step 1 & 2:
- We start every project by clearly understanding the client’s objective or goal, then defining the market scope, and aligning regions, segments, and timelines.
- Once the foundation is set, we collect data from all-around of sources, including company reports, government databases, and paid industry platforms.
- Our research is based on secondary data, which helps us build a strong understanding of the market across regions and industries. Then we validate this information through primary research by speaking directly with industry experts, companies, and stakeholders.
- By combining secondary and primary research, we ensure that our market insights are accurate, practical, and closely aligned with real market conditions.
2. Data Collection
We gather information from both public and verified sources:
3. Data Structuring
Step 3:
- All collected data is organized into a consistent format to ensure accurate analysis. Since inputs come from multiple sources, they are standardized and aligned before use.
- The data is segmented by product, application, and region, and mapped across a defined historical period (2020–2024). All values are converted into common units (USD Mn/Bn), and volume and pricing are aligned where required to estimate revenue.
- Any overlaps or inconsistencies are reviewed and adjusted to maintain accuracy (<5% variance threshold).
- The result is a structured dataset that allows for clear comparison across regions and supports reliable analysis and forecasting.
Structured Market Dataset, USD Mn/Bn
| Region | Segment | VolumeUnits | Avg PriceUSD | RevenueUSD Mn | Share % |
|---|---|---|---|---|---|
| North America | Product A | 250 | 2.5 | 500 | 15% |
| Product A | XX | XX | XX | XX | |
| Product A | XX | XX | XX | XX | |
| Consistent methodology applied across regions | |||||
4. Market Estimation
Step 4: TOP-DOWN APPROACH
- We start with the overall market size at a global or macro level.
- The market is then narrowed down based on scope and industry relevance.
- We apply penetration rates and split the data by region and segment.
- This helps us estimate the market size for specific segments.
- The numbers are validated through cross-checks to ensure accuracy.
Step 5: BOTTOM-UP APPROACH
- We begin by analyzing data from leading companies in the market.
- Revenue data is collected and mapped across different segments.
- The data is then aggregated to estimate the total market size.
- To fill in any gaps, adjustments are made based on industry standards.
- Validation checks make sure that the results are correct.
5. Forecasting
Step 6:
At Polaris Market Research & Consulting, Inc., we employ a methodical forecasting strategy. This approach blends the analysis of historical data with real-time market validation. To forecast future trends with precision, we examine past patterns, pricing fluctuations, and the interplay of supply and demand. To ensure our conclusions reflect the present market landscape, we actively seek input from industry experts and key stakeholders.
To refine our predictions, we carefully consider critical elements such as market drivers and restraints, fluctuations in raw material costs, emerging technologies, and the production capabilities of various regions. Furthermore, we assess regulatory frameworks and potential policy shifts to gauge their potential impact on market expansion.
All this information is synthesized to generate precise forecasts for each segment and region. These forecasts illuminate the current state of the market and highlight forthcoming opportunities.
6. Validation & Triangulation
Step 7:
In the final stage, we validate all our estimates using a triangulation method, where data is cross-checked from multiple reliable sources, like company data, primary interviews, and secondary research. This helps us make sure that our numbers are correct and fit with the rest of the market.
This process involves verifying data consistency across various segments and geographic areas. It also requires comparing historical trends with the assumptions support the forecast. Any discrepancies involve adjustments to ensure everything remains aligned and dependable.
Once the data is finalized, we prepare the final outputs, including market size estimates, segment-wise breakdowns, and growth metrics. These are delivered in structured formats such as tables, charts, and data files for easy analysis and use.
We collaborate closely with clients, ensuring the final products align with their requirements. This includes offering tailored adjustments, supplementary data analyses, and continuous assistance. Furthermore, we monitor market trends post-delivery, providing updates and refinements to maintain the insights' relevance as time passes.
Triangulation Framework
Estimates are cross-verified across three sources:
Company-level data
• Primary inputs from industry participants
• Secondary benchmarks and published data
Variance maintained within +5-10%
Adjustments applied to align estimates
Segment values validated against overall market structure
Data Consistency & Integrity
Segment totals validated to 100%
Regional estimates aligned with global market size
Historical trends compared against forecast outputs
Assumptions reviewed for cross-segment and regional alignment
Final Outputs
Deliverables
Client Alignment & Support
- Deliverables are aligned with defined client requirements and scope
- Custom data cuts and segment splits are incorporated as required
- Post-delivery queries are addressed through analyst interactions
- Additional clarifications and data support are provided upon request
Client Continuity & Updates
- Market developments are tracked post-delivery to capture changes in key trends
- Updated data and revisions are provided based on new market inputs
- Additional refinements and data cuts are shared as required
- Continued analyst engagement supports evolving client requirements
Download Sample Report of Jerky Snacks Market
Please fill out the form to request a customized copy of the research report.
