
Lentil Protein Market Analysis, Drivers And Growth, 2023 - 2032
REPORT DETAILS
REPORT DETAILS
ABOUT THIS REPORT
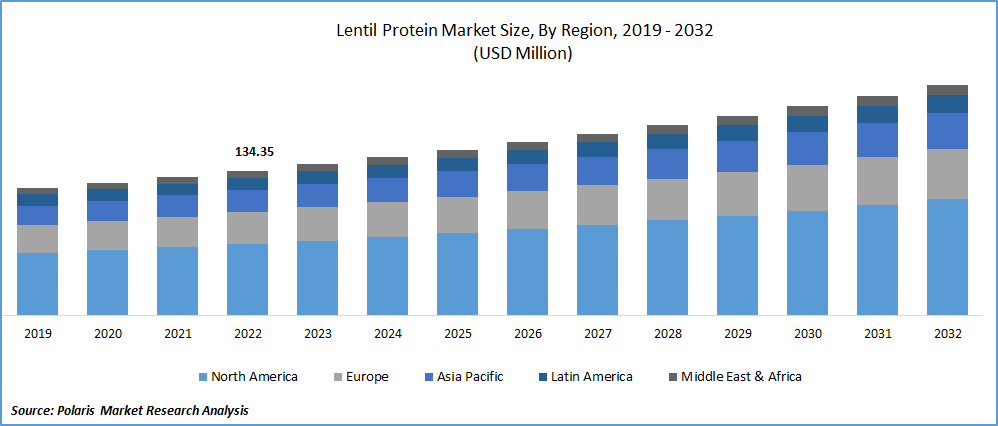
The global lentil protein market was valued at USD 134.35 million in 2022 and is expected to grow at a CAGR of 4.8% during the forecast period.
The growing proliferation of various protein-rich food products and inclining consumer behavior patterns towards plant-based and organic food products containing high amounts of lysine, arginine, aspartic acid, and glutamic acid, along with the surging adoption of lentils as an excellent source of essential amino acids, are among the primary factors driving the demand and growth of the market. Additionally, a growing number of consumers are increasingly concerned about the ingredients in their food products and prefer clean-label and natural alternatives, along with the ongoing R&D in the field of plant-based diets. Sustainable food products are likely to create huge growth potential in the market.
To Understand More About this Research: Download Sample Report
For instance, in June 2023, Synthite introduced a new plant protein. The newly developed soluble plant protein combination is likely to offer all types of essential amino acids extracted from the lentils & yellow peas.
Moreover, researchers and food companies across the world have been exploring more efficient and environmentally friendly methods to extract and purify protein from lentils and implementing novel techniques, such as ultrasound-assisted extraction and enzyme-assisted extraction, to improve protein yields and reduce energy consumption during processing.
The outbreak of the COVID-19 pandemic has significantly impacted the growth of the lentil protein market. The emergence of the deadly virus across the world forced countries to take stringent and necessary actions like lockdowns and restrictions on movement that have disrupted the supply chains for lentils and other lentil-derived products. The transportation challenges and labor shortages in certain regions have also affected the availability of lentil protein and reduced its sales all over the world.
For Specific Research Requirements: Request for Customized Report
Industry Dynamics
Growth Drivers
Increasing Demand for Allergen-Free Ingredients
The rising applications of lentil protein across various end-use industries, including sports nutrition, nutraceutical, food, and infant formula products, and the increasing need and demand for allergen-free ingredients are among the major factors driving the global lentil protein market growth. Apart from this, lentils are now being considered environmentally friendly as they require less water and produce lower greenhouse gas emissions compared to livestock farming, thereby influencing the demand and growth of the lentil protein market at a rapid pace.
Furthermore, there has been a significant increase in the number of cases of obesity. Public awareness about the food products they are consuming, including additives and preservatives being used in the products, has led to higher consumption of plant-based and healthier food products, as they contain several essential amino acids and are high in protein, which in turn, has fueled the adoption and demand all over the world. For instance, according to the World Health Organization (WHO), around 1.9 billion adults aged 18 years or above are overweight globally, and 650 million people out of these are obese, which has tripled compared to 1975. Around 39 million children under the age of 5 years are estimated to be overweight or obese in 2020.
Report Segmentation
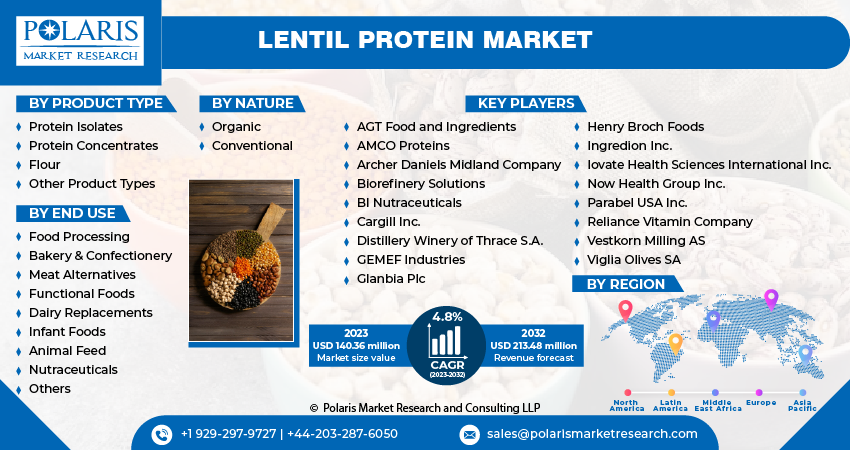
The market is primarily segmented based on product type, nature, end use, and region.
| By Product Type | By Nature | By End Use | By Region |
|
|
|
|
To Understand the Scope of this Report: Request Customization
By Product Type Analysis
Protein Isolates Segment Accounted for the Largest Market Share in 2022
The protein isolates concentrate segment accounted for more than the global share. The growth of the segment market can be largely accelerated by increasing awareness of the health and environmental benefits of plant-based diets and significantly growing adoption of protein isolates across the world due to their ability to offer a nutritious and sustainable alternative to animal-based proteins while making them attractive to health-conscious consumers and vegan population globally.
The protein concentrates segment is projected to exhibit the fastest growth rate over the next coming years, mainly attributed to growing consumer inclination and shift towards healthier eating habits and the adoption of clean-label, natural, and minimally processed foods that have fueled the need and demand for lentil protein concentrates at a rapid pace. The protein concentrates are known to offer a balanced amino acid profile that contains essential amino acids required for human nutrition and is also rich in fiber, minerals, and vitamins, resulting in higher product popularity as an attractive nutritional option for health-conscious consumers.
By Nature Analysis
The Organic Segment Held a Significant Market Revenue Share in 2022
The organic segment held the maximum market share in terms of revenue in 2022 and is expected to have a noteworthy growth rate in the coming years, owing to a continuous increase in the demand for organic and natural food products and significantly rising adoption of plant-based diets, as a result of surging concerns about the environment sustainability, animal welfare, and health. In addition, the exponential rise in the number of vegans and vegetarians across the world has also been creating a huge demand for plant-based protein sources such as lentil protein.
For instance, the number of vegans across the globe stood at around 70 million as of September 2021, and almost 2 percent of US population are identified as vegan. The number of people eating meat products will be only forty percent of the world’s population by 2040, which is estimated to increase the number of vegans globally.
By End-Use Analysis
The Nutraceuticals Segment is Projected to Witness the Highest Growth During the Forecast Period
The nutraceuticals segment is projected to grow at a healthy growth rate during the anticipated period, which is mainly driven by the prevalence of product use as a key component in protein powders and dietary supplements that cater to individuals looking to boost their protein intake for various purposes such as muscle building, weight management, and overall nutrition.
The food processing segment led the industry market with a considerable share in 2022, which is highly attributable to the rapidly surging incorporation of lentil protein in various food products because of its rich essential nutrients, including protein, fiber, vitamins, and minerals, and also low fat and cholesterol-free. Besides this, major food product manufacturers and processors are continuously looking for innovative and sustainable ingredients to meet consumer demands and investing in the development of new products with these protein sources, thereby boosting the segment market.
Regional Insights
North America Region Dominated the Global Market in 2022
North America held the largest share, mainly due to a significant rise in health and environmental awareness and the popularity of lentil protein as a rich source of plant-based protein coupled with emerging health and wellness trends. Additionally, major companies in the region have been investing in research and development to create new and improved lentil protein products like protein powders, snacks, and meat alternatives. They are adopting effective marketing strategies, which have helped them to raise consumer awareness and drive demand for the product.
The Asia Pacific region is anticipated to emerge as fastest growing region with healthy CAGR during the forecast period, on account of continuous changes in consumer eating preferences and greater demand for healthier and meat-free plant-based products along with the rising number of favorable policies and initiatives towards promoting the sustainable and plant-based food system.
Market Key Players & Competitive Insight
Companies focus on product innovation and development to cater to the rising demand for allergen-free and plant-based protein solutions. Additionally, partnerships, acquisitions, and expansions into emerging markets are commonly employed strategies to expand their reach and customer base. With the growing awareness of the health and environmental benefits of lentil protein, competition is expected to intensify further, prompting players to invest in research and development and sustainable production practices to meet evolving consumer preferences and regulatory requirements.
Some of the major players operating in the global market include:
- AGT Food and Ingredients
- AMCO Proteins
- Archer Daniels Midland Company
- Biorefinery Solutions
- BI Nutraceuticals
- Cargill Inc.
- Distillery Winery of Thrace S.A.
- GEMEF Industries
- Glanbia Plc
- Henry Broch Foods
- Ingredion Inc.
- Iovate Health Sciences International Inc.
- Now Health Group Inc.
- Parabel USA Inc.
- Reliance Vitamin Company
- Vestkorn Milling AS
- Viglia Olives SA
Recent Developments
- In April 2025, Beneo announced a €50 million investment in a new pulse processing facility to unlock faba bean potential, highlighting growing industry investment in legume protein infrastructure and supporting the broader pulse protein market, including lentils.
- In November 2022, Lentiful introduced new lentil meals. The newly developed range of meals will eliminate this time-consuming process of cooking lentils and will offer consumers a ready meal.
- In November 2022, the Broomfield family launched its new lentiful business, which aims to help people with busy lifestyles to eat healthy and plant-based meals. As consumers across the world are looking to eat healthier food products, the demand for lentil-based products has emerged drastically, and the company is looking to expand its business within the segment.
Lentil Protein Market Report Scope
| Report Attributes | Details |
| Market size value in 2023 | USD 140.36 million |
| Revenue forecast in 2032 | USD 213.48 million |
| CAGR | 4.8% from 2023 – 2032 |
| Base year | 2022 |
| Historical data | 2019 – 2021 |
| Forecast period | 2023 – 2032 |
| Quantitative units | Revenue in USD million and CAGR from 2023 to 2032 |
| Segments covered | By Product Type, Nature, End-Use, By Region |
| Regional scope | North America, Europe, Asia Pacific, Latin America, Middle East & Africa |
| Customization | Report customization as per your requirements with respect to countries, region, and segmentation. |
FAQ's
The global lentil protein market size is expected to reach USD 213.48 million by 2032.
Key players in the market are Lovate Health Sciences International, BI Nutraceuticals Biorefinery Solutions, Henry Broch Foods.
North America contribute notably towards the global lentil protein market.
The global lentil protein market is expected to grow at a CAGR of 4.8% during the forecast period.
The lentil protein market report covering key segments are product type, nature, end use, and region.
Research Methodology
A robust system of research, verification, and forecasting designed to ensure reliable and actionable market insights.
Polaris Market Research & Consulting, Inc. uses a clear and structured approach to deliver insights that clients can rely on. The process combines detailed primary and secondary research, including direct communication with industry experts. The detailed information helps build a complete picture of market trends and developments. Secondary data is gathered from credible sources such as industry reports, company filings, government source links, and trusted organization databases. It is then cross-checked through discussions with key stakeholders across the value chain. Market size and forecasts are developed using both bottom-up and top-down methods to ensure accuracy and consistency in the final results.
1. Project Setup
Step 1 & 2:
- We start every project by clearly understanding the client’s objective or goal, then defining the market scope, and aligning regions, segments, and timelines.
- Once the foundation is set, we collect data from all-around of sources, including company reports, government databases, and paid industry platforms.
- Our research is based on secondary data, which helps us build a strong understanding of the market across regions and industries. Then we validate this information through primary research by speaking directly with industry experts, companies, and stakeholders.
- By combining secondary and primary research, we ensure that our market insights are accurate, practical, and closely aligned with real market conditions.
2. Data Collection
We gather information from both public and verified sources:
3. Data Structuring
Step 3:
- All collected data is organized into a consistent format to ensure accurate analysis. Since inputs come from multiple sources, they are standardized and aligned before use.
- The data is segmented by product, application, and region, and mapped across a defined historical period (2020–2024). All values are converted into common units (USD Mn/Bn), and volume and pricing are aligned where required to estimate revenue.
- Any overlaps or inconsistencies are reviewed and adjusted to maintain accuracy (<5% variance threshold).
- The result is a structured dataset that allows for clear comparison across regions and supports reliable analysis and forecasting.
Structured Market Dataset, USD Mn/Bn
| Region | Segment | VolumeUnits | Avg PriceUSD | RevenueUSD Mn | Share % |
|---|---|---|---|---|---|
| North America | Product A | 250 | 2.5 | 500 | 15% |
| Product A | XX | XX | XX | XX | |
| Product A | XX | XX | XX | XX | |
| Consistent methodology applied across regions | |||||
4. Market Estimation
Step 4: TOP-DOWN APPROACH
- We start with the overall market size at a global or macro level.
- The market is then narrowed down based on scope and industry relevance.
- We apply penetration rates and split the data by region and segment.
- This helps us estimate the market size for specific segments.
- The numbers are validated through cross-checks to ensure accuracy.
Step 5: BOTTOM-UP APPROACH
- We begin by analyzing data from leading companies in the market.
- Revenue data is collected and mapped across different segments.
- The data is then aggregated to estimate the total market size.
- To fill in any gaps, adjustments are made based on industry standards.
- Validation checks make sure that the results are correct.
5. Forecasting
Step 6:
At Polaris Market Research & Consulting, Inc., we employ a methodical forecasting strategy. This approach blends the analysis of historical data with real-time market validation. To forecast future trends with precision, we examine past patterns, pricing fluctuations, and the interplay of supply and demand. To ensure our conclusions reflect the present market landscape, we actively seek input from industry experts and key stakeholders.
To refine our predictions, we carefully consider critical elements such as market drivers and restraints, fluctuations in raw material costs, emerging technologies, and the production capabilities of various regions. Furthermore, we assess regulatory frameworks and potential policy shifts to gauge their potential impact on market expansion.
All this information is synthesized to generate precise forecasts for each segment and region. These forecasts illuminate the current state of the market and highlight forthcoming opportunities.
6. Validation & Triangulation
Step 7:
In the final stage, we validate all our estimates using a triangulation method, where data is cross-checked from multiple reliable sources, like company data, primary interviews, and secondary research. This helps us make sure that our numbers are correct and fit with the rest of the market.
This process involves verifying data consistency across various segments and geographic areas. It also requires comparing historical trends with the assumptions support the forecast. Any discrepancies involve adjustments to ensure everything remains aligned and dependable.
Once the data is finalized, we prepare the final outputs, including market size estimates, segment-wise breakdowns, and growth metrics. These are delivered in structured formats such as tables, charts, and data files for easy analysis and use.
We collaborate closely with clients, ensuring the final products align with their requirements. This includes offering tailored adjustments, supplementary data analyses, and continuous assistance. Furthermore, we monitor market trends post-delivery, providing updates and refinements to maintain the insights' relevance as time passes.
Triangulation Framework
Estimates are cross-verified across three sources:
Company-level data
• Primary inputs from industry participants
• Secondary benchmarks and published data
Variance maintained within +5-10%
Adjustments applied to align estimates
Segment values validated against overall market structure
Data Consistency & Integrity
Segment totals validated to 100%
Regional estimates aligned with global market size
Historical trends compared against forecast outputs
Assumptions reviewed for cross-segment and regional alignment
Final Outputs
Deliverables
Client Alignment & Support
- Deliverables are aligned with defined client requirements and scope
- Custom data cuts and segment splits are incorporated as required
- Post-delivery queries are addressed through analyst interactions
- Additional clarifications and data support are provided upon request
Client Continuity & Updates
- Market developments are tracked post-delivery to capture changes in key trends
- Updated data and revisions are provided based on new market inputs
- Additional refinements and data cuts are shared as required
- Continued analyst engagement supports evolving client requirements
Download Sample Report of Lentil Protein Market
Please fill out the form to request a customized copy of the research report.
