
Network Function Virtualization Market Size, Trends, Industry Analysis Report, 2026 - 2034
REPORT DETAILS
REPORT DETAILS
ABOUT THIS REPORT
Network Function Virtualization Market Summery
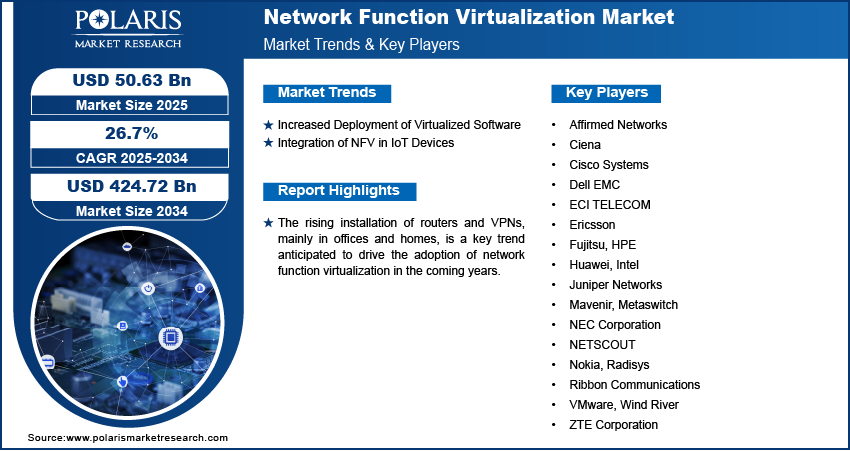
The global network function virtualization market size was valued at USD 50.51 billion in 2025. The market is projected to exhibit a CAGR of 26.7% from 2026 to 2034.
Market Statistics
Key Takeaways
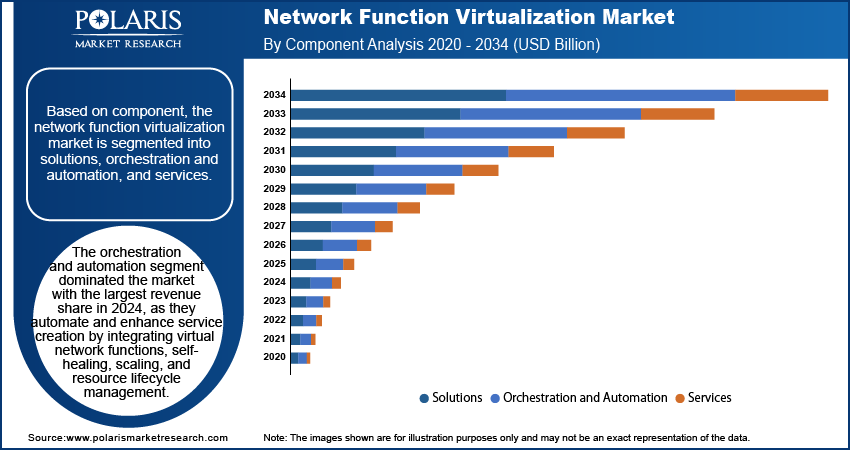
- The orchestration and automation segment dominated the market in 2025. This is because orchestration and automation make service creation easier and enable the interconnection of various virtual network functions.
- The large enterprises segment accounted for the leading position in the market in 2025. NFV helps large enterprises minimize the cost of devices and power consumption by virtue of the economies of scale.
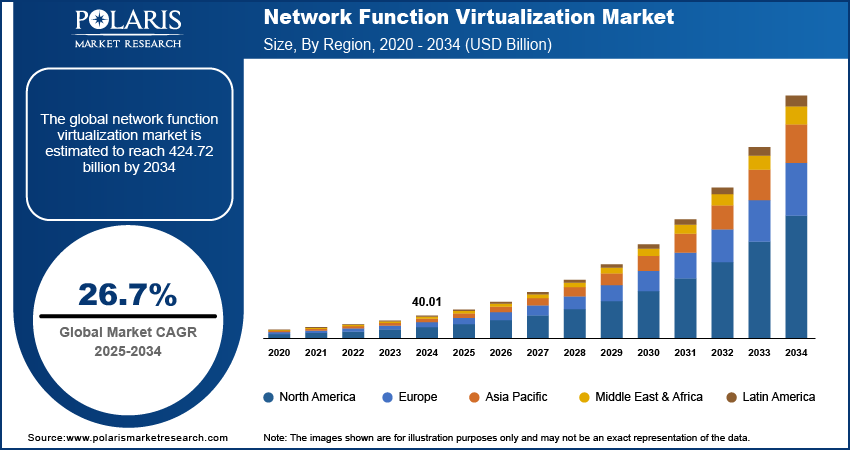
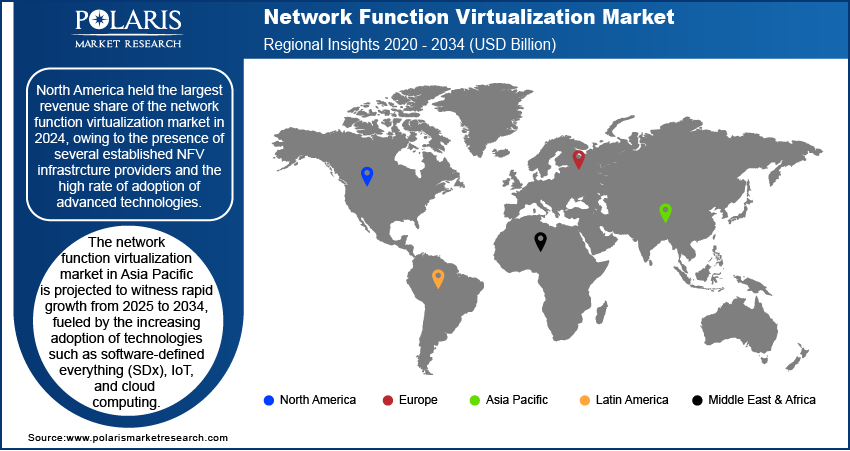
- The North America network function virtualization market accounted for the largest revenue share in 2025. This can be attributed to the presence of well-established NFV infrastructure vendors in the region.
- The Asia Pacific market is expected to register the fastest growth from 2026 to 2034 due to the adoption of technologies such as software-defined everything (SDx), IoT, and cloud computing.
Network function virtualization (NFV) is the process of separating network functions from dedicated hardware and running them as software on virtual machines. The network functions include traffic management, firewalls, routers, load balancers, and other functions. NFV can help an organization reduce network maintenance and hardware costs while optimizing service deployment.
In recent years, NFV has evolved from traditional virtual machines to cloud-native NFV solutions, where network functions are executed as containerized workloads using platforms such as Kubernetes. This evolved NFV architecture enhances scalability, automation, and flexibility, making it simpler for operators to deploy and manage services. Cloud-native NFV is especially relevant in 5G core networks, edge computing, and large data center environments, making it a key building block for telecom cloud infrastructure.
The demand for network function virtualization is driven by its increasing adoption in use cases such as session border control, video servers, evolved packet core, IP multimedia subsystems, content delivery networks, and network monitoring. These NFV use cases help telecom companies and businesses deploy services faster while maintaining stable performance.
Industry Dynamics
- The growing deployment of virtualized software is a major factor driving the expansion of the network function virtualization industry.
- The market benefits from the growing integration of NFV in Internet of Things (IoT) devices.
- Key opportunities for market participants exist in AI-driven network orchestration and private 5G.
- Operational complexity of NFV may present market challenges.
Market Statistics
- 2025 Market Size: USD 50.51 billion
- 2034 Projected Market Size: USD 424.99 billion
- CAGR (2026–2034): 26.7%
- North America: Largest Market in 2025
AI Impact on Network Function Virtualization Market
- AI helps networks operate more smoothly by detecting problems early and minimizing downtime.
- It helps optimize network resources, enabling firms to handle increasing data traffic more effectively.
- AI enables quicker decision-making, enabling service providers to respond more quickly to evolving network requirements.
- It minimizes human intervention by automating repetitive tasks, thereby reducing operating costs.
The NFV market is also aided by factors such as enhanced mobility, simplified upgrades, easier portability, and simpler software management. Increasing investments in 5G services, IoT, cloud computing, AI, server virtualization, and data center consolidation are also propelling the adoption of NFV solutions.
Telecom operators are increasingly adopting NFV to enable 5G capabilities such as network slicing, quick service creation, and API-based service delivery. This is because NFV for telecom operators allows providers to introduce new digital services quickly, develop new business models, and reduce network costs, making NFV a crucial enabler of next-generation telecom networks.
The growing adoption of routers and VPNs in offices and homes is expected to drive the network function virtualization market. Additionally, the growing adoption of virtualized software by data centers, including ISPs and cloud service providers, is opening new avenues for companies operating in the industry.
Market Dynamics
Increased Deployment of Virtualized Software
The use of virtual application technology has risen due to the growing need for digital infrastructure, including cloud and private networks. Virtual software is designed to run on virtual infrastructure. This offers more flexibility and security for the IT infrastructure, as it reduces the need for additional hardware. Additionally, it offers effective management of the data center and fast application and resource provisioning.
NFV enables companies to transition from expensive and hardware-intensive networks to more flexible and software-oriented solutions. This helps lower operating expenses and make better use of resources, contributing to the growth of the NFV market.
Integration of NFV in IoT Devices
IoT devices produce massive amounts of data that require efficient processing. NFV makes this possible by allowing the transformation of traditional network infrastructure into software-defined solutions that can be scaled easily as IoT networks expand.
NFV, in conjunction with edge computing, helps to process data closer to IoT devices. This reduces latency and improves the efficiency of applications such as smart manufacturing, healthcare, and transportation. Thus, the adoption of NFV for IoT is a major market driver.
Segment Insights
Network Function Virtualization Market Outlook by Component Insights
Based on component, the market is segmented into solutions, orchestration and automation, and services. The orchestration and automation segment led the market in 2025 because it makes service creation easier, enables the interconnection of various virtual network functions, and supports automated scaling, recovery, and management. NFV orchestration platforms, also known as NFV MANO, play a critical role in helping operators manage VNFs across a distributed network by enabling real-time resource management. This makes NFV orchestration and automation essential for large and complex NFV deployments.
Network Function Virtualization Market Outlook by Enterprise Size Insights
The NFV market, based on enterprise size, is bifurcated into SMEs and large enterprises. The large enterprises segment led the market with a revenue share of 63.5% in 2025. Large enterprises need robust network infrastructure to manage resources and increase productivity. NFV enables these organizations to reduce device costs and power consumption by enabling them to consolidate devices and leverage the economies of scale of large organizations. The high usage of network functions and virtualization across large enterprises fuels the segment’s leading market position.
Although large corporations are the main users, SMEs are gradually embracing NFV through cloud and managed services. This makes it easier for smaller companies to utilize sophisticated network functions, thus contributing to the overall growth of the market.
Network Function Virtualization Market Regional Analysis
By region, the market report offers network function virtualization market insights into North America, Europe, Asia Pacific, Latin America, and the Middle East and Africa. North America accounted for the largest market revenue share in 2025. This is due to the presence of established NFV infrastructure providers in the region and the adoption rate of advanced technologies. The increasing adoption of 5G and the rapid industrialization of major economies such as the US and Canada further drive the growth of the market.
The Asia Pacific network function virtualization (NFV) market is expected to grow at a rapid pace from 2026 to 2034, driven by the adoption of technologies such as software-defined everything (SDx), IoT, and cloud computing. The favorable government initiatives and policies, along with the growing demand for data storage and security, are also expected to drive market growth.
Network Function Virtualization Market – Key Players and Competitive Insights
The key players in the network function virtualization market are emphasizing research and development activities to improve their products and services offerings. In addition, they are adopting various strategies, such as collaborations, mergers and acquisitions, new product launches, and investments, to improve their global presence. To survive and thrive in a competitive market, the participants need to provide innovative solutions.
NFV vendors are focusing more on cloud-native network functions, open architectures, and interoperability to address evolving demands from operators and enterprises. The key to differentiation now lies in the strength of automation, performance efficiency, and the ability of solutions to work well within existing telecom and IT infrastructure.
In recent years, the market for network function virtualization has witnessed several technological and innovation breakthroughs. Leading NFV companies seek to provide advanced solutions that cater to diverse needs. Affirmed Networks, Ciena, Cisco Systems, Dell EMC, ECI TELECOM, Ericsson, Fujitsu, HPE, Huawei, Intel, Juniper Networks, Mavenir, Metaswitch, NEC Corporation, NETSCOUT, Nokia, Radisys, Ribbon Communications, VMware, Wind River, and ZTE Corporation are a few of the leading players in the market.
Cisco Systems is a leading technology company with a prominent presence in the network function virtualization market. The company helps telecommunication firms and organizations in transitioning from hardware-based networks to more flexible software-based networks. The company is working to enhance network efficiency and scalability, as well as service delivery. It also assists its customers in managing the increasing demand for data. With a vast customer base and partnerships across the global technology industry, Cisco Systems has been a major contributor to the NFV industry as networks transition to more agile environments.
Ericsson is a global communications company that has a strong presence in telecom networks. In the network function virtualization industry, the company assists service providers in migrating from a hardware-based network to a software-based network. This enables service providers to easily control their networks, roll out services quickly, and address the increasing demand for data. Ericsson has long-term ties with the telecom sector and is a key player in the NFV industry.
List of Key Companies
- Affirmed Networks
- Ciena
- Cisco Systems
- Dell EMC
- ECI TELECOM
- Ericsson
- Fujitsu
- HPE
- Huawei
- Intel
- Juniper Networks
- Mavenir
- Metaswitch
- NEC Corporation
- NETSCOUT
- Nokia
- Radisys
- Ribbon Communications
- VMware
- Wind River
- ZTE Corporation
Network Function Virtualization Industry Developments
- June 2025: Ekinops announced the acquisition of Olfeo to integrate secure access functions into its SASE portfolio. The strategic action broadened its mid-market NFV security solutions.
- February 2025: GSMA published “The Mobile Economy 2025.” It noted that 72 operator groups, representing 78.5% of global subscriptions, have committed to the Open Gateway initiative. This was an indicator of API-based monetization of NFV infrastructure.
- January 2025: HCLTech published a white paper on OSS transformation. It examined the alignment of the NFV and SDN domains to enhance cross-domain visibility and consistency.
- March 2024: The European Commission’s BEREC published guidelines on cloud-edge services. It provided a regulatory framework for interoperable, federated NFV cloud infrastructure.
- February 2024: Ericsson demonstrated its work in ETSI NFV-SEC to harmonize security responses across various orchestration stacks.
Market Segmentation
By Component Outlook (Revenue, USD Billion, 2021–2034)
- Solutions
- Orchestration and Automation
- Services
By Virtualized Network Function Outlook (Revenue, USD Billion, 2021–2034)
- Compute
- Storage
- Network
By Enterprise Size Outlook (Revenue, USD Billion, 2021–2034)
- SMEs
- Large Enterprises
By Application Outlook (Revenue, USD Billion, 2021–2034)
- Virtual Appliance
- Core Network
By Deployment Mode Outlook (Revenue, USD Billion, 2021–2034)
- On-premise
- Public Cloud
- Hybrid/Multi-cloud
By End Users Outlook (Revenue, USD Billion, 2021–2034)
- Service Providers
- Data Centers
- Enterprises
- BFSI
- Manufacturing
- Government and Defense
- Healthcare
- Retail
- Education
- IT-Enabled Services
- Others
By Regional Outlook (Revenue, USD Billion, 2021–2034)
- North America
- US
- Canada
- Europe
- Germany
- France
- UK
- Italy
- Spain
- Netherlands
- Russia
- Rest of Europe
- Asia Pacific
- China
- Japan
- India
- Malaysia
- South Korea
- Indonesia
- Australia
- Vietnam
- Rest of Asia Pacific
- Middle East & Africa
- Saudi Arabia
- UAE
- Israel
- South Africa
- Rest of Middle East & Africa
- Latin America
- Mexico
- Brazil
- Argentina
- Rest of Latin America
Network Function Virtualization Market Report Scope
| Report Attributes | Details |
| Market Size in 2025 | USD 50.51 billion |
| Market Size in 2026 | USD 63.82 billion |
| Revenue Forecast by 2034 | USD 424.99 billion |
| CAGR | 26.7% |
| Base Year | 2025 |
| Historical Data | 2021–2024 |
| Forecast Period | 2026–2034 |
| Quantitative Units | Revenue in USD billion, and CAGR from 2026 to 2034 |
| Report Coverage | Revenue Forecast, Market Competitive Landscape, Growth Factors, and Trends |
| Segments Covered |
|
| Regional Scope |
|
| Competitive Landscape | Network Function Virtualization Industry Trend Analysis (2025) Company profiles/industry participants profiling include company overview, financial information, product/service benchmarking, and recent developments |
| Report Format | PDF + Excel |
| Customization | Report customization as per your requirements with respect to countries, regions, and segmentation. |
FAQ's
The network function virtualization market size stood at USD 50.51 billion in 2025. It is projected to account for a CAGR of 26.7% between 2026 and 2034.
Network function virtualization involves separating network functions from proprietary hardware. It executes them as software in virtual machines, such as firewalls, routers, load balancers, and traffic control applications.
The market for NFV is driven by the adoption of edge computing and the rising 5G deployment. The market also benefits from the rapid integration of AI and IoT technology worldwide.
Orchestration and automation dominate the market. This is because it makes service creation easier and enables the interconnection of various virtual network functions.
North America dominates the global market. This is due to the presence of established NFV infrastructure providers in the region and the adoption rate of advanced technologies.
Download Sample Report of Network Function Virtualization Market
Please fill out the form to request a customized copy of the research report.
