
Semantic Knowledge Graphing Market Growth Analysis, 2024-2032
REPORT DETAILS
REPORT DETAILS
ABOUT THIS REPORT
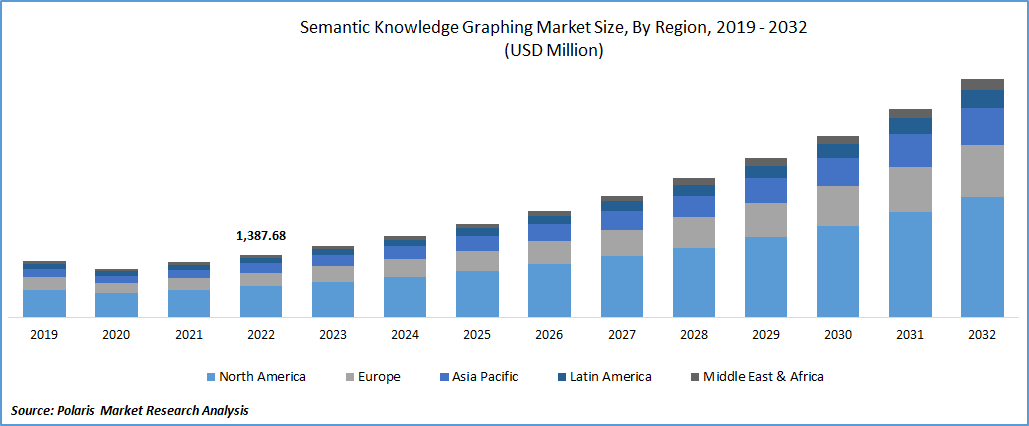
The global semantic knowledge graphing market size and share was valued at USD 1583.62 million in 2023 and is expected to grow at a CAGR of 14.30% during the forecast period. The market's expansion is propelled by organizations' need to efficiently handle and derive valuable insights from extensive and intricate datasets. The growing demand for personalized experiences and the necessity for seamless interoperability and data sharing among diverse systems also contribute to the market's growth. Additionally, the market finds applications in various industries, such as healthcare, media and entertainment, financial services, e-commerce, and manufacturing. In these sectors, semantic knowledge graphing technologies are utilized to enhance operational efficiency, lower costs, and provide personalized experiences to users.
The research report offers a quantitative and qualitative analysis of the Semantic Knowledge Graphing Market to enable effective decision-making. It covers the key trends and growth opportunities anticipated to have a favorable impact on the market. Besides, the study covers segment and regional revenue forecasts for market assessment.
A knowledge graph is defined as a knowledge base that uses a graph-structured data model for representing and operating on data. They’re typically used for storing interlinked descriptions of entities like events, objects, situations, or concepts. Along with that, knowledge graphs encode the relationships or semantics that form the basis of these entities. These graphs are usually made up of datasets from several sources, frequently differing in their structure.
Knowledge graphs consist of three main components. They are nodes, edges, and labels. In knowledge graphs, a node can take the form of a place, object, or person. An edge is used to define the relationship between the nodes. Knowledge graphs find a wide range of applications in several sectors. They’re used in the retail industry to develop cross-selling and up-selling strategies. Besides, the entertainment industry uses them for recommendation engines for content platforms. With rising data volumes on the Internet and the proliferation of the Internet of Things (IoT), the semantic knowledge graphing market is anticipated to witness robust growth over the forecast period.
To Understand More About this Research: Download Sample Report
The exponential growth of data from diverse sources, including social media, IoT devices, and digital platforms, poses a significant challenge for organizations to effectively manage, analyze, and derive meaningful insights from this vast information. Semantic knowledge graphs play a crucial role in this context by providing a structured framework to organize and contextualize the data. This enables easier search, exploration, and extraction of valuable insights. Furthermore, with the continuous advancements in AI and machine learning technologies, there is a growing demand for well-structured data that can seamlessly integrate into these systems. Semantic knowledge graphs offer a structured and organized representation of data, which can be utilized to train machine learning models and enhance the capabilities of AI systems.
The expanding internet traffic is poised to drive growth in the semantic knowledge graphing market. With the increasing number of internet users and connected devices, the volume of data being generated is growing at an unprecedented rate. However, a significant portion of this data must be more structured, challenging organizations to effectively manage and derive meaningful insights. Semantic knowledge graphs offer a solution by providing a structured framework to organize and represent data. By leveraging semantic technologies, data can be transformed into a graph-like structure that captures relationships and connections between various data elements. This facilitates the discovery of insights, analysis of data, and informed decision-making processes. As a result, the adoption of semantic knowledge graphs is expected to rise as organizations seek efficient ways to harness the potential of the expanding data landscape.
The semantic knowledge graphing market report details key market dynamics to help industry players align their business strategies with current and future trends. It examines technological advances and breakthroughs in the industry and their impact on the market presence. Furthermore, a detailed regional analysis of the industry at the local, national, and global levels has been provided.
Industry Dynamics
Growth Drivers
The increasing volume of data on the internet has created a demand for personalized experiences & tailored recommendations. These graphs offer a solution by consolidating data from various sources, such as browsing history, daily activity, & purchase history, to create a comprehensive user activity graph. This enables the delivery of personalized recommendations, targeted messages, & customized experiences that cater to individual preferences.
Moreover, the proliferation of the Internet of Things (IoT) drives the adoption of semantic knowledge graphs. These graphs provide a means to integrate and analyze data from different IoT devices, facilitating the extraction of valuable insights and enabling informed decision-making. By leveraging semantic knowledge graphs, businesses can enhance customer experiences, improve marketing strategies, and optimize operations by harnessing the power of personalized data analysis and IoT connectivity.
Report Segmentation
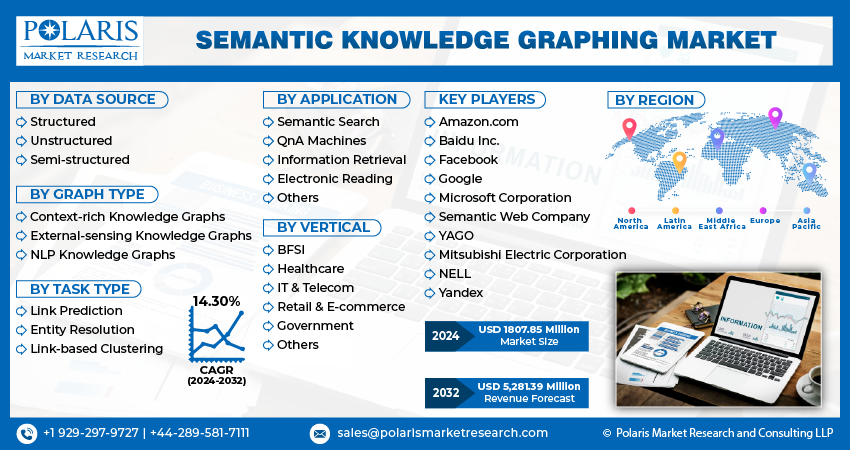
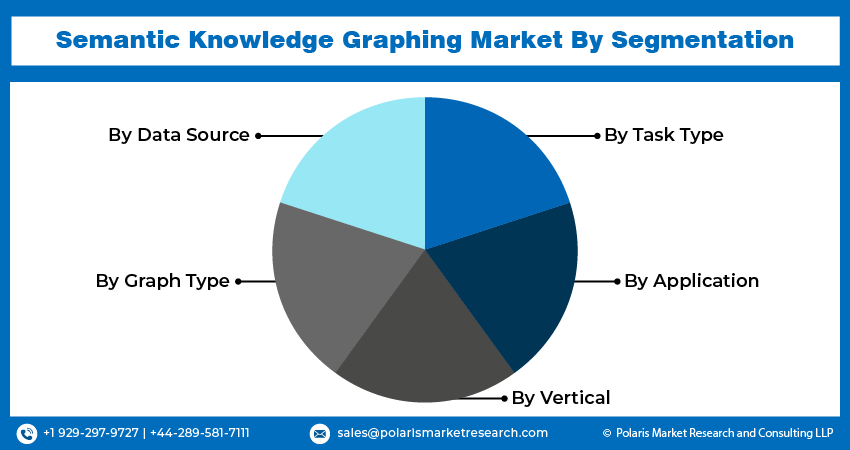
The market is primarily segmented based on by data source, knowledge graph, task type, application, vertical and region.
| By Data Source | By Graph Type | By Task Type | By Application | By Vertical | By Region |
|
|
|
|
|
|
To Understand the Scope of this Report: Request Customization
Unstructured segment accounted for the largest market share in 2022
The unstructured segment accounted for the largest market share in 2022. A notable trend within this segment is the adoption of natural language processing (NLP) techniques, which enable the extraction of meaning and context from unstructured data sources. This trend has been driven by the increasing demand to integrate diverse unstructured data types such as text, images, and video into big data platforms, allowing businesses to derive deeper insights into customer behavior, market trends, and other crucial business metrics.
The structured segment recorded a steady growth rate. Within the structured segment, there is a strong focus on developing and implementing structured data models that effectively capture and organize data, facilitating more efficient processing and analysis. Open standards such as RDF (Resource Description Framework) and OWL (Web Ontology Language) enable interoperability and seamless integration of structured data across various applications and platforms.
Link prediction segment garnered the largest share in 2022
The link prediction segment held the largest revenue share in 2022. As the field of link prediction evolves, there is a growing emphasis on enhancing the transparency and explainability of these models. This is essential to enable users to comprehend and trust the projections made by the algorithms. Researchers and developers are actively working towards ensuring that the inner workings of the link prediction models are understandable and interpretable. Moreover, the latest advancements in link prediction models consider contextual information such as time, location, and user behavior. Incorporating these contextual factors improves the accuracy and precision of predicting future relationships within knowledge graphs.
IT and Telecom is expected to witness the highest growth rate during the forecast period
IT and Telecom are expected to witness the highest growth rate during the forecast period. This growth is primarily driven by the increasing utilization of semantic knowledge graphs to enhance cybersecurity measures within the industry. By analyzing vast amounts of data, semantic knowledge graphs enable the identification of potential threats and the detection of anomalies in network traffic, bolstering cybersecurity defenses. In addition to cybersecurity applications, the IT and telecom sector leverages semantic knowledge graphs for predictive maintenance of its infrastructure. By analyzing data collected from various sources, such as sensors and other monitoring devices, knowledge graphs can predict when equipment is likely to fail. This proactive approach enables companies to schedule maintenance activities before any critical failures occur, ensuring the smooth operation of IT and telecom systems.
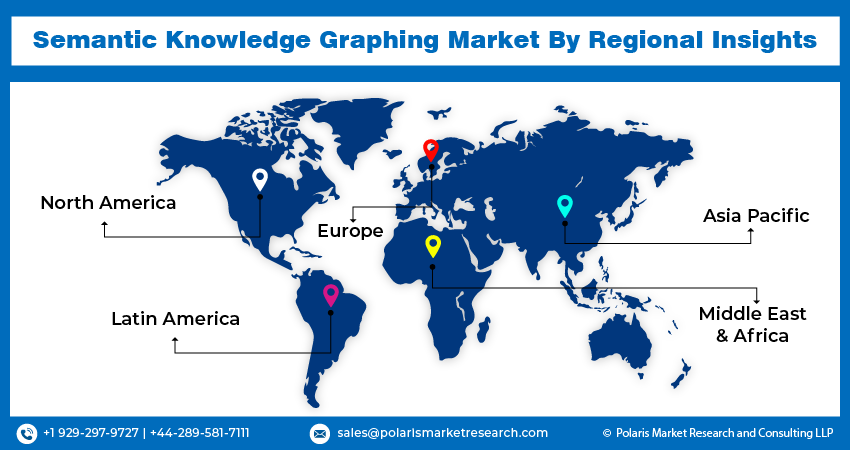
North America dominated the global market in 2022
North America dominated the global market with a considerable market share. The region's dominance can be attributed to substantial investments in semantic knowledge graph technologies, particularly in the healthcare and life sciences sectors. The United States showcased robust growth, with numerous companies actively developing solutions to enhance data interoperability and analytics using semantic knowledge graphs.
APAC registered a robust growth rate. The region's growth is primarily due to the rising demand for data integration and analytics solutions, the rapid expansion of big data, and the increasing adoption of artificial intelligence and machine learning technologies. With a strong focus on technological advancements and innovation, countries in the region are leveraging semantic knowledge graphs to address complex data challenges and unlock valuable insights. This proactive approach, coupled with the region's expanding market opportunities, positions the Asia Pacific as a key growth region for semantic knowledge graphs in the years to come.
Competitive Insight
The market is highly competitive, with a few major global competitors holding a substantial market share. The key players in the market are focused on continuous innovation and product development to stay ahead in the competition. Collaboration among industry leaders is also prevalent, as it allows for the sharing of expertise and resources to drive advancements in the market. Some of the major players operating in the global market include Amazon.com, Baidu, Inc., Facebook, Google, Microsoft Corporation, Mitsubishi Electric Corporation, NELL, Semantic Web Company, YAGO, and Yandex.
Recent Developments
- In May 2025, Kobai introduced Kobai Saturn, the first knowledge graph uniting lakehouse scalability with a no-code semantic layer. Saturn enables organizations to query and connect enterprise data in place, aligned with W3C and lakehouse standards, offering on-demand high-performance compute, native data-layer integration, and collaborative SQL views for BI and data science workflows.
- In April 2024, Altair acquired Cambridge Semantics to strengthen its analytics and AI portfolio. The deal integrated semantic graph technology into Altair’s platforms, improving data integration, contextual insight, and scalability for GenAI and enterprise AI applications.
- In March 2024, Neo4j and Microsoft formed a strategic partnership to advance enterprise AI using graph databases. By integrating Neo4j with Microsoft’s cloud and AI ecosystem, organizations can build smarter, context-aware applications with improved reasoning, recommendations, and GenAI insights.
- In October 2022, Amazon Web Services (AWS) introduced Amazon Neptune, a graph database service that caters to the storage and processing needs of extensive interconnected datasets. This service is specifically designed to handle large-scale knowledge graphs and employs semantic technologies to enable efficient querying and analysis of data.
Semantic Knowledge Graphing Market Report Scope
| Report Attributes | Details |
| Market size value in 2024 | USD 1807.85 million |
| Revenue Forecast in 2032 | USD 5,281.39 million |
| CAGR | 14.30% from 2024 – 2032 |
| Base year | 2023 |
| Historical data | 2019 – 2022 |
| Forecast period | 2024 – 2032 |
| Quantitative units | Revenue in USD million and CAGR from 2024 to 2032 |
| Segments Covered | By Data Source, By Knowledge Graph, By Task Type, By Application, By Vertical, By Region |
| Regional scope | North America, Europe, Asia Pacific, Latin America; Middle East & Africa |
| Key Companies | Amazon.com, Baidu, Inc., Facebook, Google, Microsoft Corporation, Mitsubishi Electric Corporation, NELL, Semantic Web Company, YAGO, and Yandex |
Seeking a more personalized report that meets your specific business needs? At Polaris Market Research, we’ll customize the research report for you. Our custom research will comprehensively cover business data and information you need to make strategic decisions and stay ahead of the curve.
Browse Our Top Selling Reports
Rye Market Size, Share 2024 Research Report
Packaged Salad Market Size, Share 2024 Research Report
Coworking Spaces Market Size, Share 2024 Research Report
Pessary Market Size, Share 2024 Research Report
High Altitude Platform Market Size, Share 2024 Research Report
FAQ's
The global semantic knowledge graphing market size is expected to reach USD 5,281.39 million by 2032.
Key players in the semantic knowledge graphing market are Amazon.com, Baidu, Inc., Facebook, Google, Microsoft Corporation, Mitsubishi Electric Corporation.
North America contribute notably towards the global semantic knowledge graphing market.
The global semantic knowledge graphing market is expected to grow at a CAGR of 14.3% during the forecast period.
The semantic knowledge graphing market report covering key segments are data source, graph type, task type, application, vertical and region.
Download Sample Report of Semantic Knowledge Graphing Market
Please fill out the form to request a customized copy of the research report.
