
B2B2C Insurance Market Share, Size, Trends, Industry Analysis Report, 2026 - 2034
REPORT DETAILS
B2B2C Insurance Market Summary
The global B2B2C insurance market size was valued at USD 4.06 billion in 2025. The market is projected to grow at a CAGR of 6.3% from 2026 to 2034. Increasing consumer insurance knowledge with the expansion of e-commerce and online channels is pushing demand for B2B2C insurance services.
Market Statistics
Key Takeaways
- Asia Pacific led with a 43.8% market share in 2025. This is due to its high digital uptake and government initiatives.
- China accounted for a 46.5% market share in 2025. Rising consumer awareness and financial protection schemes contribute to market dominance in the country.
- North America is expected to register the highest CAGR of 7.1%. High-tech uptake and online policy development drive the regional market growth.
- Life insurance led with a 58.4% market share in 2025. This is owing to increased demand for long-term protection through digital platforms.
- Non-life insurance is expected to grow fastest at a 7.5% CAGR. This is owing to increased demand for health, property, and motor cover
Note: Figures and projections outlined in this report are the result of Polaris Market Research’s proprietary analytical processes, grounded in the latest available datasets and market observations.
Industry Dynamics
- Increased consumer insurance consciousness is driving B2B2C insurance solution demand.
- Expansion of e-commerce and digital platforms is boosting broader use of digital insurance distribution.
- Regulatory complexity and cyber security issues are limiting market growth.
- Convergence of AI, analytics and mobile-first platforms offers excellent growth prospects for the industry.
AI Impact on B2B2C Insurance Market
- AI enables insurance firms in the B2B2C model to offer more customized products according to their customer behavior and risk profiles.
- AI speeds up the process of handling claims by automating the review of documents and fraud detection.
- AI enables better customer engagement through chatbots, virtual assistance, and real-time policy recommendations.
- AI aids in optimizing insurance operations using predictive analysis and automation.
B2B2C insurance solutions offer effective insurance distribution through collaborations among insurers, intermediaries, and digital platforms. Advanced digital technologies and analytics allow for quicker policy issuance, customized offerings, and simplified claims management. Uses include online policy sales, mobile platforms, and partner-integrated solutions that enable insurers to acquire broader customer bases and enhance customer experience.
Government efforts, financial inclusion initiatives, and regulatory backing for digital insurance are driving B2B2C insurance solution uptake. Financial protection and risk management awareness campaigns are enhancing consumer knowledge, tipping adoption in urban and emerging markets.
To Understand More About this Research: Download Sample Report Source: Polaris Market Research Analysis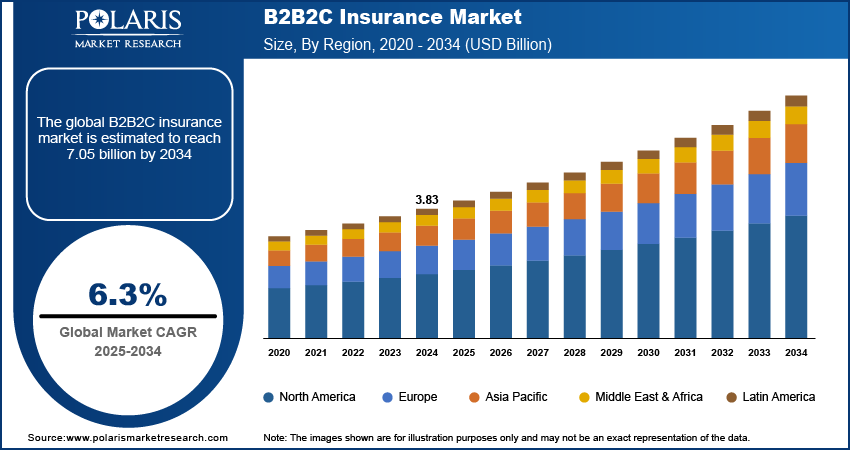
Increased digital uptake, platform infrastructure investments, and insurer-fintech collaboration are propelling market growth. Nations with robust digital ecosystems are driving platform efficiency, enhancing policy management, and providing financial and operational advantages. Arch, in July 2025, introduced new supplemental health insurance products to assist individuals in managing medical charges outside primary plan coverage. The products are portable and involve no medical underwriting.
B2B2C Insurance vs Traditional Insurance
| Aspects | B2B2C Insurance | Traditional Insurance |
| Distribution | Integrated into partner applications | Sales through brokers or branch offices |
| User Experience | Fast and hassle-free | May be manual and involve lots of paperwork |
| Ease of Access | Accessible during purchases | Needs an additional process to purchase insurance |
| Customization | AI & Data-based recommendations | Less customization |
| Efficiency | Self-service automation and automated claims management | Involves high administration |
Source: Polaris Market Research Analysis
Drivers & Opportunities
Which are the major driving factor for B2B2C insurance market growth?
Rising Consumer Insurance Awareness: Growing financial protection and risk management awareness is fueling B2B2C insurance solutions demand. Individuals are looking for bespoke policies and customized coverage, prompting insurers to increase digital and partner-based distribution channels. For instance, during July 2025, Arlo raised USD 4 million in seed funding to enable small businesses to offer affordable health insurance. The platform applies AI to make it easier to choose plans and reduce coverage costs. This trend bolsters wider adoption of insurance solutions in both urban and emerging markets.
Growth of E-commerce and Online Platforms: Expansion of E-commerce and Online Platforms: Growth in e-commerce and online platforms is facilitating insurers to reach customers more efficiently. Digital distribution channels enable frictionless purchase of policies, renewals, and claims handling. This transition is driving increased adoption of B2B2C insurance models and promoting collaborations between insurers and technology platforms.
Rising Fintech and Banking Partnerships: More banks and fintechs are now adding insurance offerings in their financial platforms to provide an end-to-end solution for their customers. By integrating insurance offerings, customers will have access to different types of insurance products like health insurance, travel insurance, payment insurance, gadget insurance, and investment-linked insurance offerings via their banks' apps, digital wallet, lending platform, and fintech platform. Through such integrations, insurers get the chance to penetrate more markets, while at the same time, fintech platforms get an additional avenue to interact with their customers and generate revenue streams. Moreover, by applying artificial intelligence in the analysis of customer data, insurance companies can customize the insurance packages according to customer behavior, expenditure patterns, travel patterns, and their financial background. Lastly, by providing customers with on-demand insurance, instantaneous policy generation, automated payment of premiums, and automated claims processing through the mobile application, insurance platforms have made it very convenient for customers to adapt to integrated insurance offerings.
To Understand More About this Research: Download Sample Report Source: Polaris Market Research Analysis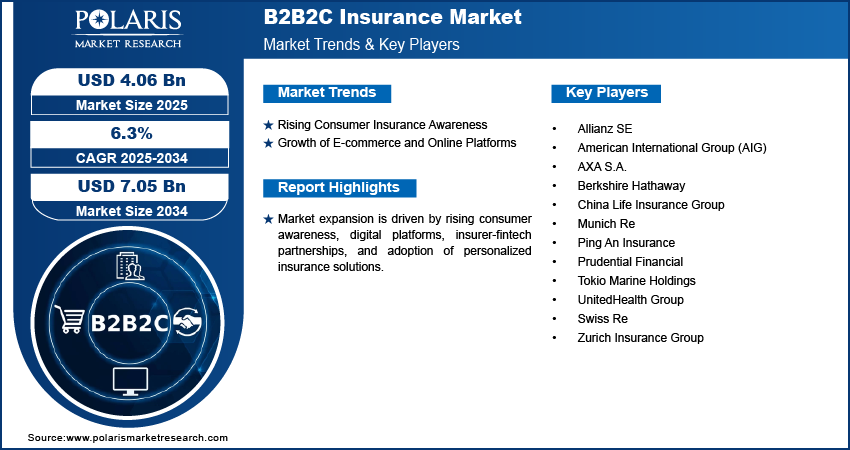
Segmental Insights
Insurance Analysis
Based on insurance, segmentation consists of life insurance and non-life insurance. The life insurance segment was the market leader in 2025 with 58.4% share, led by increasing consumer knowledge about financial protection and long-term savings. Additionally, increasing use of digital and partner-based distribution platforms is also aiding strong revenue growth throughout the forecast years.
The non-life insurance segment is expected to expand at the highest CAGR of 7.5% between 2026–2034, fueled by increasing demand for covering property, health, and autos. Furthermore, the growth of web-based platforms and collaborations with fintech suppliers is also boosting market uptake. In September 2025, BHSI has introduced Group Personal Accident and Business Travel insurance in the UK, which includes real-time risk notifications, tracking of employees, emergency services, and virtual care assistance.
Distribution Channel Analysis
On the basis of distribution channel, the market is segmented into online and offline. The offline distribution channel dominated in 2025 due to growing partnerships among insurer with banks, agents, and retail networks. In addition, increased customer confidence in conventional channels and hybrid service strategies is also driving quicker uptake.
Online distribution channel is expected to expand at the highest rate through the forecast period due to convenience, real-time policy management, and effortless customer interaction. Additionally, increasing e-commerce integration and digitalization in urban and semi-urban areas are also contributing to tremendous revenue growth in the market.
To Understand More About this Research: Request Customization Source: Polaris Market Research Analysis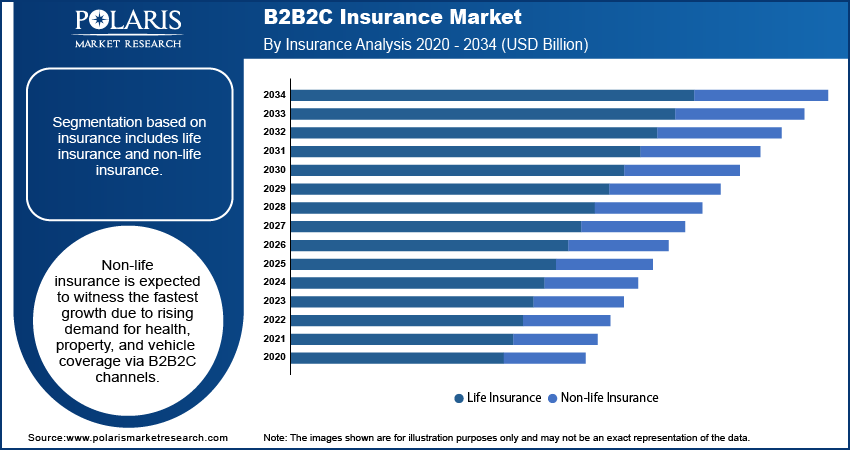
Regional Analysis
Asia Pacific led the B2B2C insurance industry in 2025 with 43.8% share, fueled by fast digital penetration and increased financial inclusion programs in emerging economies. Also, increasing consumer consciousness regarding financial security and savings over the long term is further driving market growth. Furthermore, initiatives by the government for increased insurance accessibility are also driving adoption.
China B2B2C Insurance Market Insight
China dominated the regional market with 46.5% share in 2025 on the account of growing e-commerce platforms and robust insurer collaborations with fintech players. Furthermore, rising urbanization and digital literacy also fuel adoption. Besides, government initiatives promoting insurance penetration by middle-class consumers also support growth.
Europe B2B2C Insurance Market
Europe has a large market share owing to stringent regulatory environments fostering consumer protection and insurance transparency. Further, high insurance penetration in mature economies is also aiding adoption. Additionally, collaborations between banks and insurers are paving the way for effective B2B2C distribution models.
North America B2B2C Insurance Market
North America is anticipated to expand at the highest CAGR of 7.1% from 2026–2034, owing to integration of innovative technology into insurance platforms and robust investment in digital infrastructure. Further, increasing demand for online management of policies is also driving adoption. Additionally, favorable regulatory environments boost market growth.
The U.S. B2B2C Insurance Market Overview
The U.S. market is growing as a result of high digital penetration and insurer partnerships with tech and e-commerce platforms. Additionally, increased financial protection and risk management awareness is also fueling adoption. For example, in July 2025, QBE North America launched a Life Sciences insurance product providing liability coverage for medical device, pharmaceutical, and clinical trial firms. Additionally, encouraging government policies for digital insurance further contribute to growth.
To Understand More About this Research: Request Customization Source: Polaris Market Research Analysis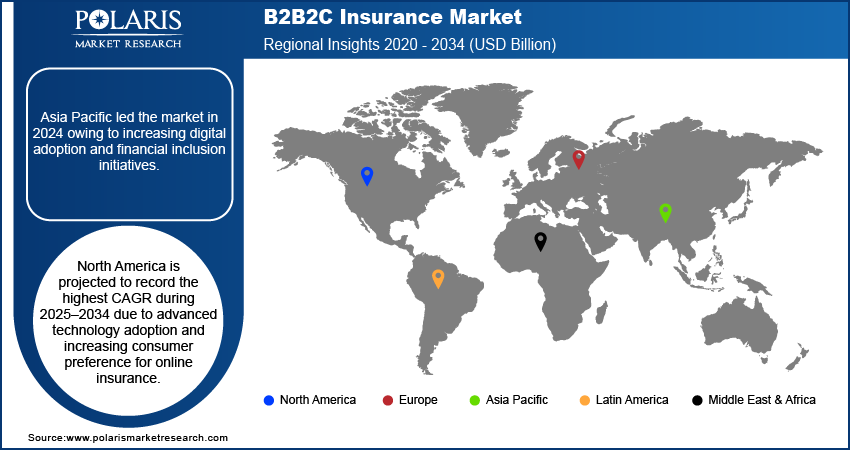
Key Players & Competitive Analysis Report
The B2B2C insurance industry is relatively competitive, with businesses ramping up capabilities on digital channels, partner ecosystems, and customized insurance products. Further, investments in big data analytics, mobile-first applications, and strategic collaboration with fintechs, banks, and online platforms improve customer experience, policy management, and market coverage.
Who are the major key players in B2B2C insurance market?
Some of the key market leaders include UnitedHealth Group, Allianz SE, Berkshire Hathaway, AXA S.A., Ping An Insurance, China Life Insurance Group, Zurich Insurance Group, Prudential Financial, Munich Re, Swiss Re, American International Group (AIG), and Tokio Marine Holdings.
Key Players
- Allianz SE
- American International Group (AIG)
- AXA S.A.
- Berkshire Hathaway
- China Life Insurance Group
- Munich Re
- Ping An Insurance
- Prudential Financial
- Tokio Marine Holdings
- UnitedHealth Group
- Swiss Re
- Zurich Insurance Group
Industry Developments
-
May 2026: Generali Group introduced a new brand for its global Care platform, Redion. The platform brings the activities of Europ Assistance and Generali Employee Benefits (GEB) under a single offering and identity. (source: generali.com)
-
March 2026: Allianz Group (Allianz) and Jio Financial Services Limited (JFSL) announced the commencement of the operations of their reinsurance joint venture, Allianz Jio Reinsurance Limited (Allianz Jio Re). The JV aims to establish itself as a strategic long-term partner in the Indian sector. (source: allianz.com).
B2B2C Insurance Market Segmentation
By Insurance Outlook (Revenue, USD Billion, 2021–2034)
- Life Insurance
- Non-life Insurance
- Health Insurance
- Property & Casualty Insurance
- Travel Insurance
- Motor Insurance
- Specialty Insurance
- Others
By Distribution Channel Outlook (Revenue, USD Billion, 2021–2034)
- Online
- Offline
- Insurance Companies
- Banks
- Airlines
- Insurance Aggregators and Comparison Websites
- Others
By Regional Outlook (Revenue, USD Billion, 2021–2034)
- North America
- U.S.
- Canada
- Europe
- Germany
- France
- UK
- Italy
- Spain
- Netherlands
- Russia
- Rest of Europe
- Asia Pacific
- China
- Japan
- India
- Malaysia
- South Korea
- Indonesia
- Australia
- Vietnam
- Rest of Asia Pacific
- Middle East & Africa
- Saudi Arabia
- UAE
- Israel
- South Africa
- Rest of Middle East & Africa
- Latin America
- Mexico
- Brazil
- Argentina
- Rest of Latin America
B2B2C Insurance Market Report Scope
| Report Attributes | Details |
| Market Size in 2025 | USD 4.06 Billion |
| Market Size in 2026 | USD 4.43 Billion |
| Revenue Forecast by 2034 | USD 7.05 Billion |
| CAGR | 6.3% from 2026 to 2034 |
| Base Year | 2025 |
| Historical Data | 2021–2024 |
| Forecast Period | 2026–2034 |
| Quantitative Units | Revenue in USD Billion and CAGR from 2026 to 2034 |
| Report Coverage | Revenue Forecast, Competitive Landscape, Growth Factors, and Industry Trends |
| Segments Covered |
|
| Regional Scope |
|
| Competitive Landscape |
|
| Report Format |
|
| Customization | Report customization as per your requirements with respect to countries, regions, and segmentation. |
Source: Polaris Market Research Analysis
FAQ's
The global market size was valued at USD 4.06 billion in 2025 and is projected to grow to USD 7.05 billion by 2034.
The global market is projected to register a CAGR of 6.3% during the forecast period.
Asia Pacific led the market with 43.8% share due to rapid digital adoption and rising consumer awareness of insurance products.
A few of the key players in the market are UnitedHealth Group, Allianz SE, Berkshire Hathaway, AXA S.A., Ping An Insurance, China Life Insurance Group, Zurich Insurance Group, Prudential Financial, Munich Re, Swiss Re, American International Group (AIG), and Tokio Marine Holdings.
Life insurance dominated with 58.4% due to high demand for long-term protection and savings products offered through digital and partner-based channels.
Online distribution is expected to grow fastest due to rising digital adoption and increasing partnerships with fintechs and e-commerce platforms.
Download Sample Report of B2B2C Insurance Market
Please fill out the form to request a customized copy of the research report.
