
Global Tissue Diagnostics Market Size, Share & Growth Analysis Report, 2024-2032
REPORT DETAILS
REPORT DETAILS
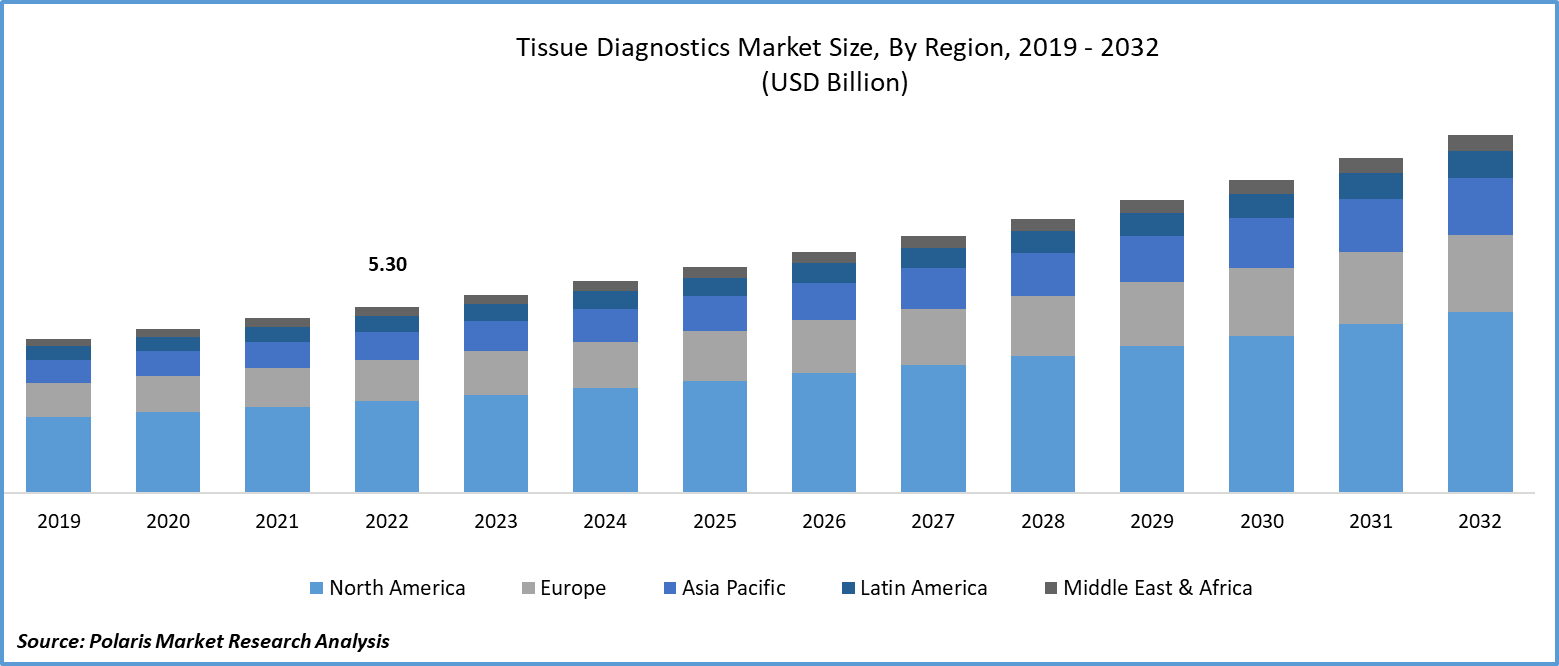
The global tissue diagnostics market was valued at USD 5.65 billion in 2023 and is expected to grow at a CAGR of 6.8% during the forecast period.
The growing incidence of cancer worldwide, tissue diagnostics enables pathologists to analyze tissue samples and determine the presence, type, and stage of cancer, aiding in treatment decisions. Moreover, the demand for tissue diagnostics is expected to grow with the rising geriatric population and the associated increase in age-related diseases.
The Tissue Diagnostics Market report details key market dynamics to help industry players align their business strategies with current and future trends. It examines technological advances and breakthroughs in the industry and their impact on the market presence. Furthermore, a detailed regional analysis of the industry at the local, national, and global levels has been provided.
Tissue diagnostics include transferring tissues from the patient's body, which are then refined, inspected, and tested under the microscope to expose illnesses such as cancer. In medical jargon, tissue diagnostics indicates the surgical pathological assessment of tissues of the body. It is one of the gold grades for cancer diagnosis. The methodology assists in deciding the cause and effect of the illness in a patient. It is an important segment of committing oneself to appropriate caregiving. In the absence of precise diagnostics, appropriate therapy cannot be given to a patient.
Computerization and digitization of pathologies will play an important part in the progression of this segment. For instance, digital pathology sanctions pathologists to perceive and diagnose digital depictions of the surgical pathology slides designed from biopsied and resectioned tissue. The tissue diagnostics market size is expanding as this enhances clinical efforts, ascertains precision in clinical results, and can assist in rendering important health know-how obtainable to patients and healthcare donors speedily and economically.
To Understand More About this Research: Download Sample Report
Technological advancements have revolutionized tissue diagnostics, developing more accurate and efficient diagnostic tools and techniques. For instance, digital pathology has emerged as a significant innovation in the field, allowing pathologists to analyze digital images of tissue samples remotely and collaborate with experts worldwide. This improves diagnostic accuracy and facilitates efficient diagnosis.
For instance, In January 2023, Thermo Fisher Scientific and AstraZeneca collaborated to develop a companion diagnostic test for Tagrisso, identifying NSCLC patients eligible for treatment based on specific EGFR alterations.
This market refers to the field of medicine that involves the examination of tissues and cells to diagnose diseases and conditions. It plays a crucial role in the early detection, accurate diagnosis, and effective treatment of various diseases, including cancer. The market for tissue diagnostics has been witnessing significant growth due to advancements in technology, the increasing prevalence of chronic diseases, and the rising demand for personalized medicine.
In addition, the increasing focus on personalized medicine is also driving the market's growth. Personalized medicine aims to provide targeted treatments based on an individual's genetic makeup and specific disease characteristics. Tissue diagnostics is crucial in identifying biomarkers and genetic abnormalities that can guide personalized treatment decisions, leading to better patient outcomes.
However, the market was initially impacted by the COVID-19 pandemic, with a temporary slowdown due to healthcare disruptions and shifted priorities. However, the importance of tissue diagnostics in COVID-19 diagnosis and management led to an increased demand for testing and accelerated the adoption of digital pathology solutions. As vaccination programs progress and healthcare services normalize, the market is expected to recover, with opportunities for growth and innovation.
Growth Drivers
Advancements in Imaging Techniques and Improved Diagnostics Affordability
The continuous advancements in imaging techniques, such as MRI, CT scan, PET scan, and ultrasound, have significantly improved the accuracy and efficiency of diagnostic procedures. These advanced imaging technologies provide detailed and precise images of tissues and organs, allowing for better visualization and detecting abnormalities. Additionally, technological advancements have reduced the cost of diagnostic procedures, making them more affordable and accessible to a larger population. This accessibility has contributed to increased early detection and diagnosis of diseases, leading to better patient outcomes.
Personalized medicine has gained significant momentum driven by genomics and molecular diagnostics advancements. Customized therapeutics and diagnostics involve tailoring medical treatments and interventions based on an individual's genetic profile, disease characteristics, and other factors. Tissue diagnostics are vital in identifying biomarkers and genetic abnormalities that help determine the most appropriate treatment options for individual patients. The increasing understanding of the molecular basis of diseases, coupled with the availability of targeted therapies, has fueled the demand for personalized therapeutics and diagnostics.
Report Segmentation
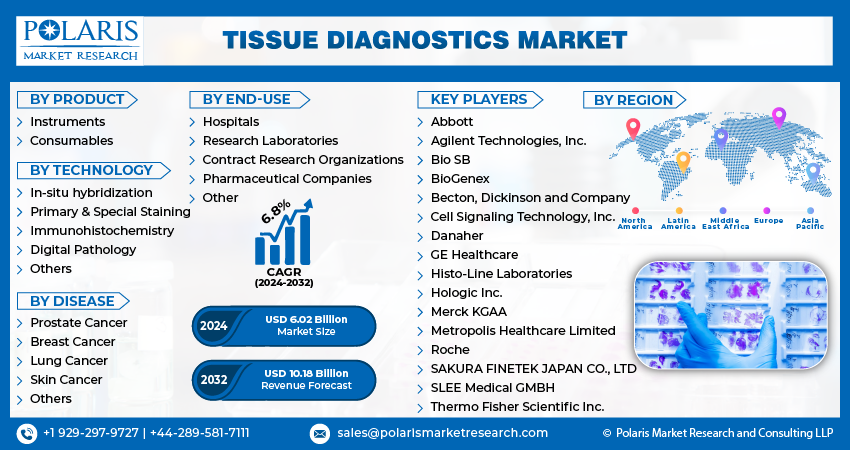
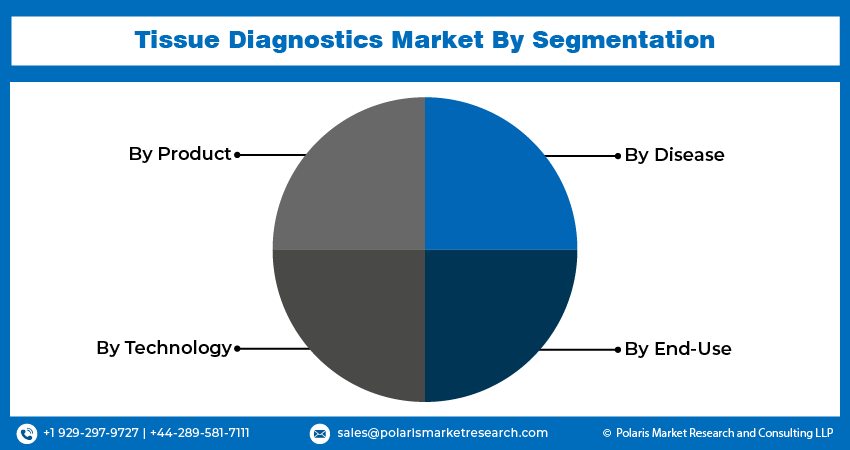
The market is primarily segmented based on product, technology, disease, end-use, and region.
| By Product | By Technology | By Disease | By End-Use | By Region |
|
|
|
|
|
To Understand the Scope of this Report: Request Customization
By Product
Consumable Segment is Expected to Witness Highest Growth During Forecast Period
The consumable segment of the market is expected to witness steady growth over the forecast period as healthcare providers and researchers continue to rely on these critical products for accurate and reliable tissue analysis. The consumable segment of the tissue diagnostics market comprises a range of essential products used in tissue sample preparation, analysis, and testing. These consumables play a crucial role in various stages of tissue diagnostics, including specimen collection, preservation, processing, staining, and analysis. They include reagents, antibodies, probes, fixatives, stains, slides, and other laboratory supplies.
The demand for tissue diagnostics consumables is driven by the increasing incidence of cancer and other chronic diseases, the growing adoption of personalized medicine, and advancements in diagnostic technologies.
By Technology
Immunohistochemistry Segment Accounted for the Largest Market Share in 2022
The immunohistochemistry segment accounted for the largest revenue share of the market. Immunohistochemistry (IHC) is extensively utilized in the clinical research and development of cancer diagnostics and therapeutics. IHC is highly favored over traditional enzyme staining techniques due to its ability to distinguish between tumor types with greater specificity. In contrast, conventional methods have limited capabilities in detecting tissue structures, enzymes, and proteins associated with tumors. The versatility and precision of IHC have positioned it as a preferred choice, empowering researchers to uncover a broader range of tumor characteristics and enabling advancements in cancer diagnosis and treatment.
By End-Use
Hospitals Segment Held the Largest Market Revenue Share in 2022
The hospitals segment is emerging as holding the market's largest revenue share in 2022. This dominance can be attributed to the extensive utilization and high demand for tissue diagnostic solutions within hospital settings. Physicians increasingly adopt tissue-based diagnostic testing techniques over conventional methods due to their enhanced efficiency and utility. Tissue diagnostic tests offer reduced timelines compared to traditional approaches, prompting physicians to switch. The convenience and time-saving benefits associated with tissue diagnostics have contributed to their widespread adoption in hospitals, positioning them as the primary users of these solutions.
Contract research organizations (CROs) are expected to experience substantial growth in the market. CROs play a vital role by offering research support, managing clinical trials, and performing various functions for companies and healthcare providers facing budget limitations. The increasing number of clinical trials and extensive research studies on cancer therapy have significantly boosted the demand for CRO services.
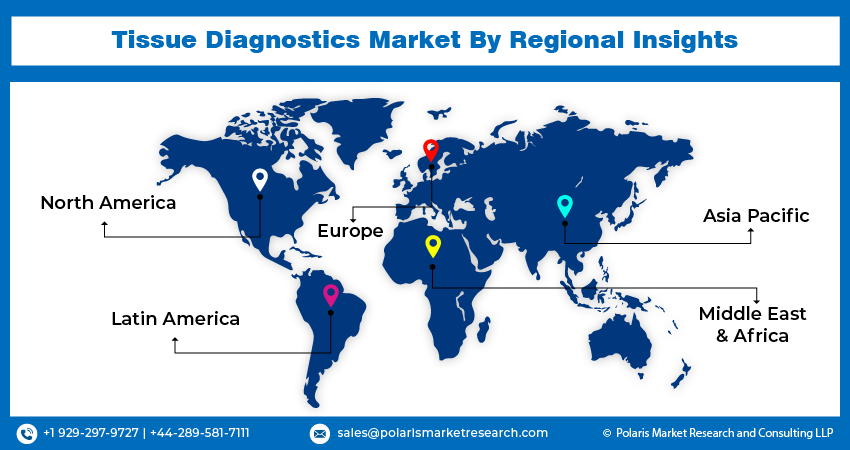
Regional Insights
North America Region Dominated the Global Market in 2022
North America holds the largest revenue share in the tissue diagnostics market, and likely to hold its dominance over the forecast period, due to the region's high cancer incidence rate. The presence of numerous public programs aimed at reducing cancer incidence has resulted in increased demand for cancer diagnosis supplements in the tissue diagnostics market. A special program in this regard is the Cancer Prevention and Control Research Network, initiated by the Centers for Disease Control and Prevention, which focuses on cancer prevention efforts in North America.
Personalized medicine heavily relies on human tissue to develop innovative tests. Adopting sequencing technologies and healthcare IT systems in the clinical workflow has immensely grown personalized medicine, consequently driving the demand for tissue diagnostics. The Precision Medicine Initiative in the United States further contributes to the growth of the personalized medicine industry, creating additional opportunities for the tissue diagnostics market in North America.
Key Market Players & Competitive Insights
In the competitive tissue diagnostics market, key players employ various strategies to gain a competitive edge. Market consolidation through mergers, acquisitions, and collaborations is prevalent, enabling companies to expand their portfolios and enhance their technological capabilities. Significant investments in research and development drive technological advancements such as automation systems and digital pathology platforms. Partnerships and collaborations with other industry stakeholders expedite the developing and commercialization of new diagnostic tests and therapies.
Some of the major players operating in the global market include:
- Abbott
- Agilent Technologies, Inc.
- Bio SB
- BioGenex
- Becton, Dickinson and Company (BD)
- Cell Signaling Technology, Inc.
- Danaher
- GE Healthcare
- Histo-Line Laboratories
- Hologic Inc.
- Merck KGAA
- Metropolis Healthcare Limited
- Roche
- SAKURA FINETEK JAPAN CO., LTD
- SLEE Medical GMBH
- Thermo Fisher Scientific Inc.
Recent Developments
- In June 2023, Roche Tissue Diagnostics is expanding its cancer-detecting instrument and test production by constructing a 60,000-square-foot building in Marana adjacent to an existing distribution center. The new facility will house all instrument manufacturing operations, which will be relocated from Roche's main campus in Oro Valley. The move aims to increase production capacity and meet the growing demand for their products.
- In January 2023, Agilent Technologies partnered with Akoya Biosciences to develop multiplex-immunohistochemistry diagnostic solutions for tissue analysis and commercialize workflow solutions for multiplex assays in the clinical research market. The collaboration aims to integrate Agilent's Dako Omnis and Akoya's PhenoImager HT to create a comprehensive end-to-end workflow for mIHC and mIF assays.
Tissue Diagnostics Market Report Scope
| Report Attributes | Details |
| Market size value in 2024 | USD 6.02 billion |
| Revenue forecast in 2032 | USD 10.18 billion |
| CAGR | 6.8% from 2024 – 2032 |
| Base year | 2023 |
| Historical data | 2019 – 2022 |
| Forecast period | 2024– 2032 |
| Quantitative units | Revenue in USD billion and CAGR from 2024 to 2032 |
| Segments covered | By Product, By Technology, By Disease, By End-Use, By Region |
| Regional scope | North America, Europe, Asia Pacific, Latin America, Middle East & Africa |
| Customization | Report customization as per your requirements with respect to countries, region, and segmentation. |
Want to check out the Tissue Diagnostics Market report before buying it? Then, our sample report has got you covered. It includes key market data points, ranging from trend analyses to industry estimates and forecasts. See for yourself by downloading the sample report.
Browse Our Top Selling Reports
Microfluidics Market Size, Share 2024 Research Report
Pelvic Floor Electric Stimulator Market Size, Share 2024 Research Report
Endodontic Files Market Size, Share 2024 Research Report
Non-Pvc Iv Bags Market Size, Share 2024 Research Report
Terminal Sterilization Services Market Size, Share 2024 Research Report
Download Sample Report of Global Tissue Diagnostics Market Size, Share & Growth Analysis Report, 2024-2032
Please fill out the form to request a customized copy of the research report.
