
Tray Sealing Machines Market Demand, Business Insights, 2025-2034
REPORT DETAILS
Tray Sealing Machines Market Summary
The global tray sealing machines market size was valued at USD 1,288.94 million in 2024, growing at a CAGR of 4.2% during 2025–2034. The growth is driven by the rising demand for convenience and ready-to-eat foods.
Market Statistics
Tray sealing machines are automated packaging systems designed to seal food or pharmaceutical products in pre-formed trays using heat and pressure, assuring an airtight and secure closure. These machines have become integral to flexible packaging operations due to the growing focus on maintaining product integrity, safety, and freshness. The increasing need for extended shelf life and improved food safety further drives the demand for these machines. For instance, in September 2024, the US EDA granted USD 500,000 to the University of Wisconsin-Stevens Point to advance sustainability in Wisconsin’s packaging, supporting research and development efforts in the sector. Manufacturers are under pressure to adopt technologies that prevent contamination and spoilage, with rising consumer awareness and regulatory focus on food hygiene. Tray sealing offers a protective barrier against external factors such as moisture, air, and bacteria, thus preserving product quality and safety over an extended period.
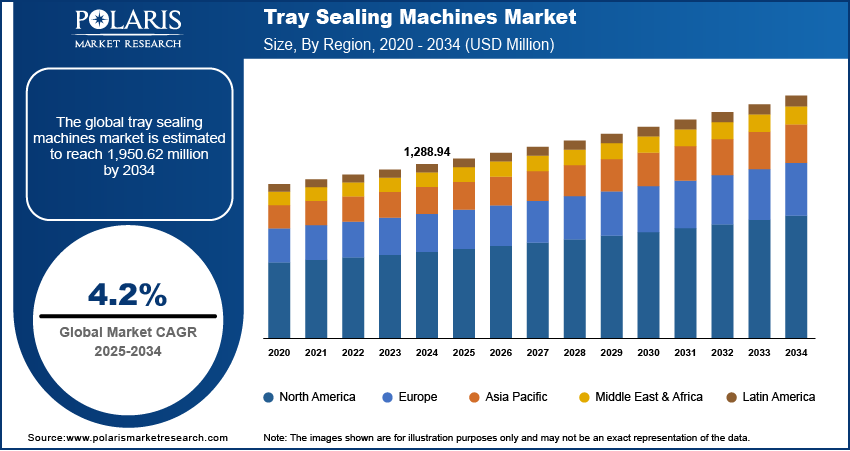
Source: Polaris Market Research Analysis
To Understand More About this Research: Download Sample Report
The expansion of food processing and packaging industries across both developed and emerging markets drives the market revenue. An April 2025 IBEF report projected India's food processing sector to grow from USD 307 billion in 2023 to USD 700 billion by 2030, fuelled by rising demand for processed foods. Food manufacturers are investing in advanced packaging solutions to meet volume, quality, and compliance requirements as global demand for ready-to-eat meals, convenience foods, and perishable items continues to rise. Tray sealing machines offer high throughput, customization capabilities, and compatibility with various materials, making them well-suited for modern, automated food production lines. Their ability to support efficient, scalable packaging operations positions them as a critical asset in the evolving food packaging landscape.
Industry Dynamics
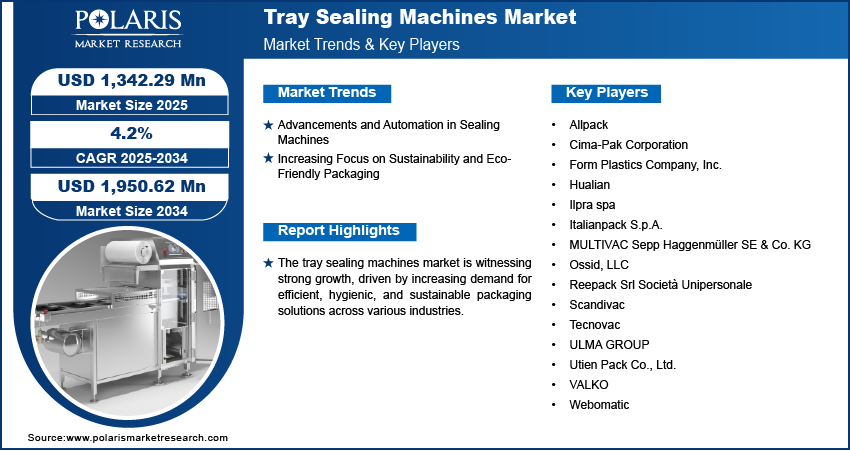
Advancements and Automation in Sealing Machines
Manufacturers increasingly seek precision, efficiency, and consistency in their packaging operations. Modern tray sealing machines are now equipped with intelligent controls, faster cycle times, and improved adaptability to various tray materials and sizes. For instance, in September 2022, Echomachinery launched an automated tray sealing machine, replacing manual processes to enhance productivity and hygiene. The system minimizes user intervention and supports diverse applications such as fresh produce, meat, and ready meals. Automation reduces labor dependency and operational errors while increasing throughput and assuring uniform sealing quality. These technological improvements align with the demand for scalable, high-speed production environments, particularly in sectors such as food processing and pharmaceuticals. The integration of advanced and automated systems is shaping the next generation of packaging lines, reinforcing the importance of tray sealing machines in optimized production workflows. Thus, advancements and automation in sealing machine technology are driving the market.
Increasing Focus on Sustainability and Eco-Friendly Packaging
The growing focus on sustainability and green packaging is influencing the adoption of tray sealing solutions. Manufacturers are under increasing pressure to reduce their environmental footprint by minimizing packaging waste and shifting toward recyclable or compostable materials. For instance, in March 2025, Green Lab, a subsidiary of Frasers & Neave Group, expanded into the US market, offering FSC-certified recycled paper bags and cost-competitive eco-friendly food packaging. Tray sealing machines support this shift by enabling precise material usage, compatibility with sustainable tray and film options, and reduced energy consumption through efficient sealing mechanisms. This alignment with environmental goals supports regulatory compliance and also meets the preferences of environmentally conscious consumers. Consequently, the role of tray sealing machines is expanding as a sustainable packaging tool in both industrial strategy and brand positioning.
Source: Polaris Market Research Analysis
Segmental Insights
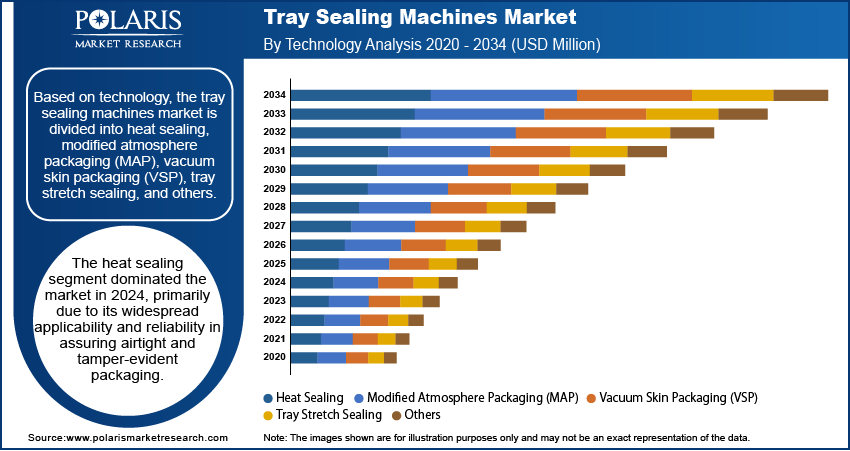
By Technology Analysis
The global tray sealing machines market segmentation, based on technology, includes heat sealing, modified atmosphere packaging (MAP), vacuum skin packaging (VSP), tray stretch sealing, and others. The heat sealing segment dominated the market in 2024, primarily due to its widespread applicability and reliability in assuring airtight and tamper-evident packaging. Heat sealing offers a high degree of compatibility with various film materials and tray types, making it a preferred solution across diverse end-use industries. The technology is valued for its ability to maintain product integrity, reduce contamination risks, and improve shelf life, which are critical factors in food and pharmaceutical packaging. Moreover, its cost-effectiveness and ease of integration into existing packaging lines further reinforce its dominance.
By Machine Type Analysis
The segmentation, based on machine type, includes fully automatic, semi-automatic, and manual. The fully automatic segment is expected to witness substantial growth during the forecast period, driven by rising demand for high-speed, labor-efficient packaging operations. These machines streamline the entire sealing process from tray loading to sealing and discharge, offering consistent performance with minimal human intervention. Fully automatic tray sealers help improve productivity and reduce operational errors as industries increasingly adopt smart manufacturing practices. Their integration with advanced control systems and real-time monitoring capabilities also supports improved quality assurance, making them a strategic investment for large-scale production facilities.
By Operation Speed Analysis
The segmentation, based on operation speed, includes Up to 3 CPM, 4 to 8 CPM, 9 to 12 CPM, and above 12 CPM. The above 12 CPM segment is expected to witness substantial growth during the forecast period due to the rising need for high-output packaging lines. These high-speed machines cater to large-volume production environments, especially in the food & beverage sector, where demand for ready-to-eat and convenience products is increasing. Their ability to seal more trays in less time enhances throughput and operational efficiency, helping manufacturers meet tight production deadlines and market demand. The growing shift toward automation and optimized line performance is further boosting the adoption of these high-capacity machines.
By End Use Analysis
The segmentation, based on end use, includes food & beverage, pharmaceuticals, cosmetics & personal care, consumer goods, electronics, and others. The food & beverage segment is expected to witness the fastest growth during the forecast period, owing to increasing demand for packaged, fresh, and convenience food products. Tray sealing machines play a pivotal role in assuring food safety, extending shelf life, and maintaining product aesthetics, all of which are essential in this highly regulated industry. Innovations in packaging formats, combined with the surge in ready-meal consumption, are driving manufacturers to invest in flexible and efficient tray sealing systems. The segment also benefits from changing dietary habits and the rapid expansion of cold chain logistics.
Source: Polaris Market Research Analysis
Regional Analysis
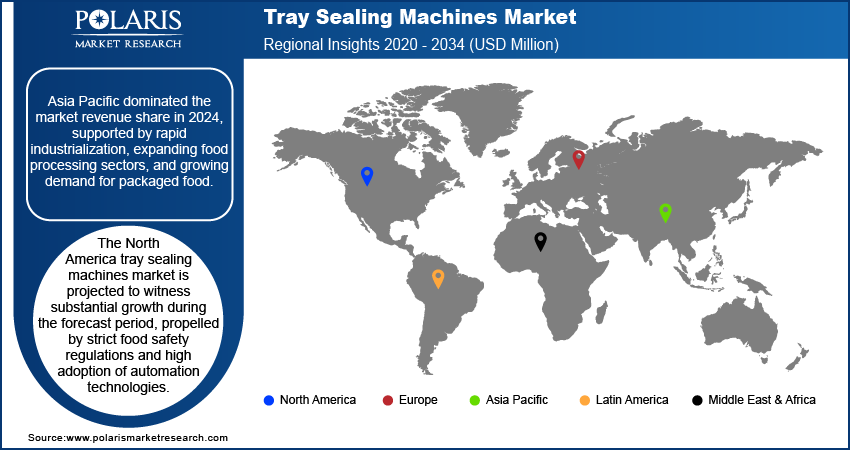
The report provides market insights into North America, Europe, Asia Pacific, Latin America, and the Middle East & Africa. Asia Pacific tray sealing machines market dominated the revenue share in 2024, supported by rapid industrialization, expanding food processing sectors, and growing demand for packaged food. The region’s increasing population, rising urbanization, and improving economic conditions have accelerated the adoption of automated packaging solutions. Countries such as China, Japan, and South Korea are major contributors, with substantial investments in food safety, manufacturing infrastructure, and technology-driven packaging processes. For instance, in March 2021, the World Bank approved a USD 400 million loan for China's Food Safety Improvement Project, aiming to improve national and local food safety management and reduce risks in major supply chains. These factors collectively highlight the region’s strong position in the market.
The North America tray sealing machines market is projected to witness substantial growth during the forecast period, propelled by strict food safety regulations and high adoption of automation technologies. The region's mature food and beverage sector demands packaging systems that ensure hygiene, consistency, and operational efficiency. The trend toward sustainable packaging and the integration of smart manufacturing practices are further boosting demand for advanced tray sealing solutions. The US and Canada are major markets with well-established production and retail sectors that continue to invest in packaging innovation.
The Europe tray sealing machines market is projected to witness significant growth during the forecast period, supported by strict environmental and food safety standards as well as a strong focus on sustainable packaging practices. The region’s manufacturers are increasingly adopting tray sealing solutions that align with eco-friendly objectives and regulatory compliance. Additionally, the demand for premium packaging in ready meals and convenience foods is driving technology upgrades in packaging lines. A few major contributing countries include Germany, France, Italy, and the UK, each with advanced food processing industries and substantial investments in automation.
Source: Polaris Market Research Analysis
Key Players and Competitive Analysis
The tray sealing machines sector is experiencing growth opportunities driven by rising demand in food & beverage and pharmaceuticals, fueled by sustainable value chains and automation trends. Technological advancements such as AI-driven sealing and energy-efficient designs are reshaping competitive positioning, with Europe and North America leading in developed markets due to strict hygiene standards. Meanwhile, emerging markets in Asia Pacific show latent demand from expanding processed food sectors. Major players focus on strategic investments in R&D and expansion opportunities, while SMEs leverage niche business segments such as cosmetics packaging. Supply chain disruptions and raw material costs remain challenges, but future development strategies highlight modular, high-speed machines (12+ CPM) to meet scalability needs. Expert insights highlight untapped potential in modified atmosphere packaging (MAP) for fresh food, aligning with trends toward shelf-life extension. A few key players are Allpack; Cima-Pak Corporation; Form Plastics Company, Inc.; Hualian; Ilpra spa; Italianpack S.p.A.; MULTIVAC Sepp Haggenmüller SE & Co. KG; Ossid, LLC; Reepack Srl Società Unipersonale; Scandivac; Tecnovac; ULMA GROUP; Utien Pack Co., Ltd.; VALKO; and Webomatic.
Form Plastics Company, Inc. is into the design and manufacturing of high-quality tray sealing machines tailored for the food packaging industry. The company offers a wide range of packaging solutions, such as automatic, semi-automatic, and manual tray sealing machines, as well as lidding equipment. Their machines are designed to provide reliable, consistent seals that improve product shelf life, ensure food safety, and improve packaging efficiency. Form Plastics highlights safety and versatility in its machines, catering to a wide variety of tray shapes and production volumes. One of their flagship products, the HHA600 Automatic Tray Sealer, is engineered for high-volume food packaging operations, capable of sealing up to 7,200 trays per hour. It is highly durable and customizable, with machine lengths adjustable in 4-foot increments to fit specific production requirements. Other models include the AL300X, a cost-effective automatic tray sealer with adjustable speed control, and the MiniMatic III, a tabletop automatic machine ideal for intermediate volume packaging with output up to 25 trays per minute. Semi-automatic models such as the HCSA100 and HCM100 offer flexibility with interchangeable sealing plates to accommodate hundreds of tray styles, making them labor-efficient and versatile.
Reepack Srl Società Unipersonale is an Italian manufacturer specializing in flexible and tray packaging machinery, with over 25 years of experience in the industry. Headquartered in Seriate, Bergamo, Reepack is recognized for its innovative solutions in food packaging, serving a diverse clientele ranging from small processors to large-scale industrial operations. The company’s portfolio includes vacuum chambers, thermoformers, horizontal flow wrappers, and, notably, an extensive range of tray sealing machines. These sealing machines are designed to address a wide spectrum of packaging needs, from simple sealing to advanced applications such as Modified Atmosphere Packaging (MAP) and Vacuum Skin Packaging (VSP). Their product line features both semi-automatic and fully automatic tray sealers, suitable for small-batch testing, medium-scale production, and high-output industrial lines. Models such as the ReeMaster NextGen series represent the latest advancements, offering high efficiency, precision, and seamless integration into automated packaging lines for three-shift operations. These machines can be configured with various tray transport systems, pusher rods, or grippers and are compatible with complementary equipment such as tray denesters, conveyors, and labeling devices.
Key Players
- Allpack
- Cima-Pak Corporation
- Form Plastics Company, Inc.
- Hualian
- Ilpra spa
- Italianpack S.p.A.
- MULTIVAC Sepp Haggenmüller SE & Co. KG
- Ossid, LLC
- Reepack Srl Società Unipersonale
- Scandivac
- Tecnovac
- ULMA GROUP
- Utien Pack Co., Ltd.
- VALKO
- Webomatic
Industry Developments
In January 2025, JBT Proseal installed its 8,000th machine at Bakkavor Group, marking a milestone that enhances production efficiency and sustainability.
In July 2025, John Bean Technologies Corporation (JBT) acquired Alco-food-machines GmbH & Co. KG, a Germany-based food processing machinery manufacturer.
In February 2025, ProMach acquired Zanichelli Meccanica S.p.A., an Italy-based manufacturer of food processing equipment.
In December 2024, JBT Proseal installed its 8,000th tray sealing machine with Bakkavor Group, marking a milestone in its product evolution. The new models replace legacy F40/F45 units after 20 years of service.
In October 2024, IPG launched its iTrack tape monitoring system for case sealers. The system detects tape errors, jams, and low rolls while optimizing uptime and energy use by halting machines during idle periods.
In April 2024, SEE and Ossid partnered to offer case-ready processors integrated tray overwrapping solutions, combining Ossid’s machinery with SEE’s materials. The collaboration aims to improve operational efficiency and sustainability for fresh protein producers through optimized packaging systems.
Tray Sealing Machines Market Segmentation
By Type Outlook (Revenue, USD Million, 2020–2034)
- Fully Automatic
- Semi-Automatic
- Manual
By Technology Outlook (Revenue, USD Million, 2020–2034)
- Heat Sealing
- Modified Atmosphere Packaging (MAP)
- Vacuum Skin Packaging (VSP)
- Tray Stretch Sealing
- Others
By Operation Speed Outlook (Revenue, USD Million, 2020–2034)
- Up to 3 CPM
- 4 to 8 CPM
- 9 to 12 CPM
- Above 12 CPM
By End Use Outlook (Revenue, USD Million, 2020–2034)
- Food & Beverage
- Pharmaceuticals
- Cosmetics & Personal Care
- Consumer Goods
- Electronics
- Others
By Regional Outlook (Revenue, USD Million, 2020–2034)
- North America
- US
- Canada
- Mexico
- Europe
- Germany
- France
- UK
- Italy
- Spain
- Netherlands
- Russia
- Rest of Europe
- Asia Pacific
- China
- Japan
- India
- Malaysia
- South Korea
- Indonesia
- Australia
- Vietnam
- Rest of Asia Pacific
- Middle East & Africa
- Saudi Arabia
- UAE
- Israel
- South Africa
- Rest of Middle East & Africa
- Latin America
- Brazil
- Argentina
- Rest of Latin America
Tray Sealing Machines Market Report Scope
| Report Attributes | Details |
| Market Size Value in 2024 | USD 1,288.94 million |
| Market Size Value in 2025 | USD 1,342.29 million |
| Revenue Forecast by 2034 | USD 1,950.62 million |
| CAGR | 4.2% from 2025 to 2034 |
| Base Year | 2024 |
| Historical Data | 2020–2023 |
| Forecast Period | 2025–2034 |
| Quantitative Units | Revenue in USD Million and CAGR from 2025 to 2034 |
| Report Coverage | Revenue Forecast, Competitive Landscape, Growth Factors, and Industry Trends |
| Segments Covered |
|
| Regional Scope |
|
| Competitive Landscape |
|
| Report Format |
|
| Customization | Report customization as per your requirements with respect to countries, regions, and segmentation. |
Source: Polaris Market Research Analysis
Tray Sealing Machines Market FAQ's
The global market size was valued at USD 1,288.94 million in 2024 and is projected to grow to USD 1,950.62 million by 2034.
The global market is projected to register a CAGR of 4.2% during the forecast period.
Asia Pacific dominated the market share in 2024.
A few of the key players in the market are Allpack; Cima-Pak Corporation; Form Plastics Company, Inc.; Hualian; Ilpra spa; Italianpack S.p.A.; MULTIVAC Sepp Haggenmüller SE & Co. KG; Ossid, LLC; Reepack Srl Società Unipersonale; Scandivac; Tecnovac; ULMA GROUP; Utien Pack Co., Ltd.; VALKO; and Webomatic.
The heat sealing segment dominated the market in 2024.
The food & beverage segment is expected to witness the fastest growth during the forecast period.
Download Sample Report of Tray Sealing Machines Market
Please fill out the form to request a customized copy of the research report.
