
Robot Charging Station Market Size Industry Share Report, 2025-2034
REPORT DETAILS
REPORT DETAILS
ABOUT THIS REPORT
Robot Charging Station Market Summary
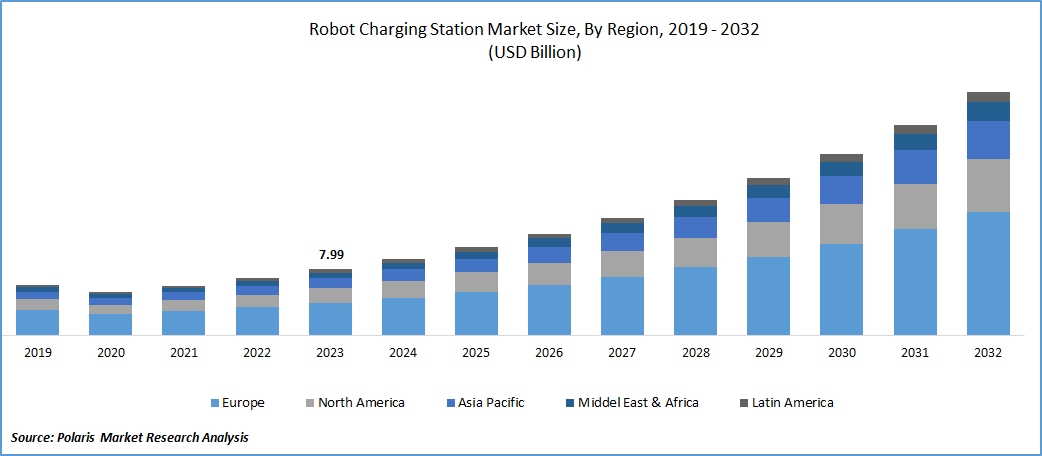
The global robot charging station market size was valued at USD 1,520.22 million in 2024. It is projected to grow from USD 1,773.49 million in 2025 to USD 7,263.76 million by 2034, exhibiting a CAGR of 17.0% during 2025–2034.
Market Statistics
A robot charging station is an automated facility designed to recharge the batteries of robots or electric vehicles (EVs) without human intervention. These stations use robotic arms, advanced sensors, and sometimes artificial intelligence to autonomously locate, connect, and deliver power to a wide range of devices, including autonomous cars, drones, and autonomous mobile robots.
A notable trend in the market is the seamless incorporation of artificial intelligence. Charging stations now feature sophisticated AI algorithms, enabling them to independently locate and connect to EVs and adapt to varying environmental conditions. These intelligent solutions optimize charging techniques by considering factors such as battery health, grid demand, and user preferences, enhancing the efficiency and user experience of the charging process, thereby encouraging trust and fueling popularity.
The market expansion is linked to the widespread adoption of electric vehicles (EVs) worldwide. According to data published by the International Energy Agency, electric car sales in 2023 were 3.5 million higher than in 2022, a 35% year-on-year increase. This increasing adoption of EVs is creating pressure on the existing charging infrastructure. Traditional charging stations struggle to meet demand, especially in high-traffic areas or during peak hours. To solve this challenge, companies and service providers are investing in robotic charging stations that automate the process and reduce wait times. These robotic systems quickly connect and charge vehicles without human intervention, increasing throughput and convenience. Therefore, as EV numbers grow, cities, parking facilities, and fleet operators are seeking automated solutions, including robot charging stations, to streamline operations and maximize space efficiency.
The rising focus on autonomous driving is accelerating the demand for robot charging stations. Additionally, investments in eco-friendly charging solutions, driven by efforts to enhance sustainability and reduce carbon emissions, are further propelling the robot charging station market growth.
The robot charging station market experienced moderate disruptions during the initial phase of the COVID-19 pandemic, marked by supply chain interruptions and manufacturing delays due to lockdowns and restrictions. However, as the pandemic continued, it accelerated specific trends in the market. The increased emphasis on contactless and touchless solutions, driven by health concerns, led to a significant rise in demand for autonomous robot charging solutions and systems. These systems, capable of conducting charging operations without human involvement, became popular due to their alignment with the need for minimized physical interaction.
To Understand More About this Research: Download Sample Report
Market Dynamics
Increasing Adoption of Robots Worldwide
Industries across the world, such as logistics, manufacturing, healthcare, and retail, rely on robots to perform critical tasks around the clock. These robots require efficient and reliable charging solutions to maintain productivity. This propels businesses to install robot charging stations to minimize downtime and ensure seamless operation. The new World Robotics report recorded 4,281,585 units operating in factories worldwide in 2023, an increase of 10% from 2022. Autonomous mobile robots, delivery bots, and warehouse machines all depend on quick, automated charging to stay functional, driving companies to invest in robot charging stations. Thus, the rising reliance on robots directly drives the need for robot charging systems that keep robots powered and ready for action.
Growing E-commerce Sector Worldwide
E-commerce retailers are expanding their operations to meet rising consumer expectations for fast and accurate deliveries, driving them to deploy fleets of robots for tasks such as sorting, packing, and transporting goods. These robots work long hours and require constant charging to maintain efficiency. E-commerce companies are installing robot charging stations to reduce downtime and avoid disruptions in the supply chain by providing efficient and seamless charging to fleets of robots. According to data published by the International Trade Administration, global B2C ecommerce revenue is expected to grow to USD 5.5 trillion by 2027 at a steady CAGR of 14.4%. Hence, the rapid growth of e-commerce continues to push investments in charging infrastructure that supports the scale and speed of modern fulfillment operations.
Segment Analysis
Market Evaluation by Type
Based on type, the robot charging station market is divided into fixed robot charging and mobile robot charging. The mobile robot charging segment dominated the market share in 2024. Mobile robot chargers, with their ability to move freely and service multiple vehicles across various locations, have gained prominence in urban settings, parking facilities, and areas with high EV traffic. Unlike traditional fixed chargers, these innovative systems are agile and adaptable, autonomously navigating within specific zones. This mobility enables them to efficiently locate EVs requiring charging, reducing the necessity for dedicated charging stations.
The fixed robot charging segment is expected to grow at a rapid pace in the coming years. Fixed charging stations are evolving to provide higher charging capacities, with the advancement of EVs. These stations are engineered to offer rapid & ultra-fast charging, drastically reducing the time needed to recharge an EV's battery. This development is in line with the increasing demand for quicker charging solutions, addressing the requirements of both individual consumers and commercial vehicle fleets, contributing to the segmental growth.
Market Insight by Level of Charging
Based on level of charging, the robot charging station market is segregated into level 1, level 2, and level 3. The level 2 segment dominated the market share in 2024 due to its strong balance between charging speed and infrastructure cost. Businesses favored level 2 systems as they offer faster charging than level 1 while avoiding the high costs and technical requirements associated with level 3. Warehouses, manufacturing facilities, and commercial environments widely adopted level 2 chargers to support fleets of autonomous mobile robots (AMRs) and automated guided vehicles (AGVs). These environments operate on tight schedules and demand consistent uptime, making level 2 an ideal choice. The ability to charge multiple robots in a moderate time frame without overloading power systems made level 2 the preferred option across industries focused on productivity and cost-efficiency.
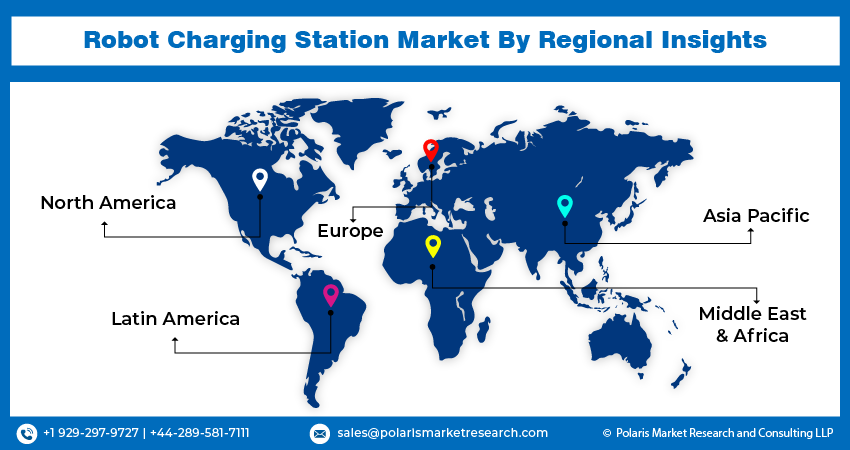
Regional Outlook
By region, the robot charging station market report provides insight into North America, Europe, Asia Pacific, Latin America, and the Middle East & Africa. Asia Pacific accounted for a major market share in 2024 due to rapid industrial automation, expanding e-commerce, and strong government support for robotics and smart infrastructure. The rising urbanization and the expansion of industrial smart cities in countries such as Japan, India, and South Korea supported the demand for advanced charging infrastructure, such as robot charging stations, to power robot fleets. In August 2024, the Government of India approved 12 new industrial cities under the National Industrial Corridor Development Programme (NICDP). Moreover, China invested heavily in robotics to boost manufacturing efficiency and address labor shortages. China dominated the regional market by deploying large-scale robotic fleets across warehouses, factories, and logistics hubs. The country’s strong domestic production of robots and charging technologies, coupled with its commitment to becoming a global leader in automation, fueled market growth.
The market in North America is expected to grow at a rapid pace in the coming years, owing to its strong focus on autonomous systems in sectors such as logistics, defense, healthcare, and retail. The US is estimated to emerge as the leading country in the region, owing to large-scale automation across industries and supporting R&D in robotics. The growing adoption of warehouse automation by major players such as Amazon and Walmart is increasing the need for scalable and efficient charging solutions such as robot charging stations. Moreover, favorable government policies supporting the adoption of EVs and rising investments in AI-driven charging infrastructure are projected to boost North America’s position in the market during the forecast period.
Key Players and Competitive Analysis
The global robot charging station market is highly competitive, with key players strategically leveraging mergers and acquisitions (M&A), partnerships, product portfolio expansions, and collaborations to strengthen their market position. Companies are focusing on innovation, scalability, and integration with autonomous systems to meet the growing demand for robotic charging solutions across industries such as logistics, manufacturing, healthcare, and retail. Major players are engaging in M&A activities to consolidate market share and enhance technological capabilities. These moves accelerate R&D and reduce time-to-market for advanced charging solutions. Collaborations between robotics firms and energy providers are becoming crucial in the market. Companies are further diversifying their offerings to cater to different robot types such as AGVs, AMRs, and agriculture drones.
The market is fragmented, with the presence of numerous global and regional market players. A few major players in the market are ALVERI Ltd; Autev; EV Safe Charge Inc.; EVAR Inc.; Hyundai Motor Group; Mob-Energy S.A.S; NaaS Technology, Inc.; ROCSYS; Volkswagen; and VOLTERIO GmbH.
Hyundai Motor Group, a prominent South Korean automotive conglomerate and one of the world’s largest automotive manufacturers, with its headquarters in Seoul. Established in 1998 following Hyundai’s acquisition of Kia Motors, HMG has grown into a global powerhouse, encompassing a wide range of businesses such as automobiles, steel, construction, logistics, finance, and IT services. The group’s core automotive brands, Hyundai, Kia, Genesis, and Ioniq, are recognized worldwide, and HMG maintains a significant presence in North America, Europe, Asia Pacific, and other regions, with manufacturing facilities in countries such as the US, China, India, Turkey, and the Czech Republic. Recognizing the growing demand for electric vehicles (EVs) and the need for more accessible and efficient charging infrastructure, Hyundai’s Robotics Lab has engineered an automatic charging robot (ACR) specifically designed for EVs.
NaaS Technology Inc., headquartered in Beijing, is one of China’s largest and fastest-growing electric vehicle (EV) charging service providers, and the first US-listed EV charging company from China. Founded in 2019, NaaS offers a comprehensive suite of integrated online and offline EV charging solutions. Its services span from mobility connectivity, SaaS-based station management, and payment systems to hardware procurement, site selection, engineering, station maintenance, and energy storage. NaaS also provides amenities such as vending machines and car wash tunnels, serving a wide range of clients, including charging station operators, charger manufacturers, and EV OEMs.
List of Key Companies
- ALVERI Ltd
- Autev
- EV Safe Charge Inc.
- EVAR Inc.
- Hyundai Motor Group
- Mob-Energy S.A.S
- NaaS Technology, Inc.
- ROCSYS
- Volkswagen
- VOLTERIO GmbH
Robot Charging Station Industry Developments
January 2024: NaaS Technology showcased its automatic energy supply charging robot at CES 2024 in Las Vegas. Designed for intelligent and unmanned EV charging, the mobile robot uses advanced perception and localization systems to identify vehicles, manage movement, and perform precise parking autonomously.
Robot Charging Station Market Segmentation
By Type Outlook (Revenue, USD Million, 2020–2034)
- Fixed Robot Charging
- Mobile Robot Charging
By Level of Charging Outlook (Revenue, USD Million, 2020–2034)
- Level 1
- Level 2
- Level 3
By Application Outlook (Revenue, USD Million, 2020–2034)
- Parking Facilities
- Airports
- Retail Centers & Malls
- Others
By Regional Outlook (Revenue, USD Million, 2020–2034)
- North America
- US
- Canada
- Europe
- Germany
- France
- UK
- Italy
- Spain
- Netherlands
- Russia
- Rest of Europe
- Asia Pacific
- China
- Japan
- India
- Malaysia
- South Korea
- Indonesia
- Australia
- Vietnam
- Rest of Asia Pacific
- Middle East & Africa
- Saudi Arabia
- UAE
- Israel
- South Africa
- Rest of Middle East & Africa
- Latin America
- Mexico
- Brazil
- Argentina
- Rest of Latin America
Robot Charging Station Market Report Scope
| Report Attributes | Details |
| Market Size Value in 2024 | USD 1,520.22 Million |
| Market Size Value in 2025 | USD 1,773.49 Million |
| Revenue Forecast in 2034 | USD 7,263.76 Million |
| CAGR | 17.0% from 2025 to 2034 |
| Base Year | 2024 |
| Historical Data | 2020–2023 |
| Forecast Period | 2025–2034 |
| Quantitative Units | Revenue in USD Million and CAGR from 2025 to 2034 |
| Report Coverage | Revenue Forecast, Market Competitive Landscape, Growth Factors, and Trends |
| Segments Covered |
|
| Regional Scope |
|
| Competitive Landscape |
|
| Report Format |
|
| Customization | Report customization as per your requirements with respect to countries, regions, and segmentation. |
FAQ's
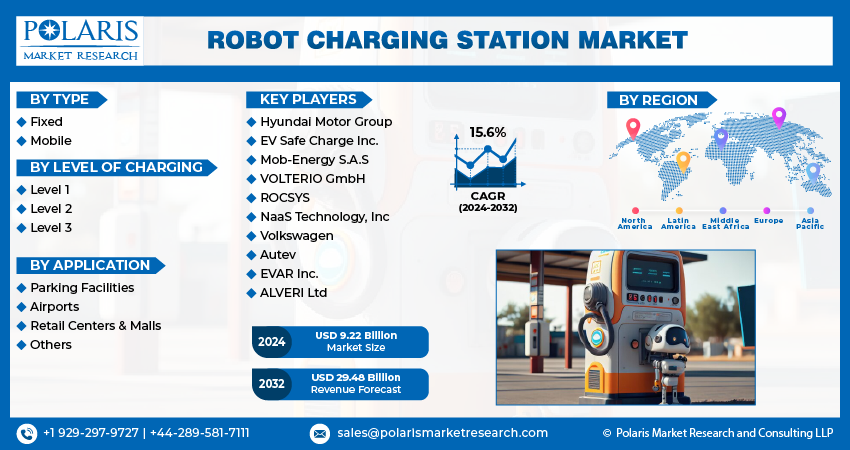
The global robot charging station market size is expected to reach USD 29.48 billion by 2032
Hyundai Motor, EV Safe Charge, Mob-Energy, VOLTERIO, ROCSYS, NaaS Technology, Volkswagen are the top market players in the market.
Europe region contribute notably towards the global Robot Charging Station Market.
The global robot charging station market is expected to grow at a CAGR of 15.6% during the forecast period.
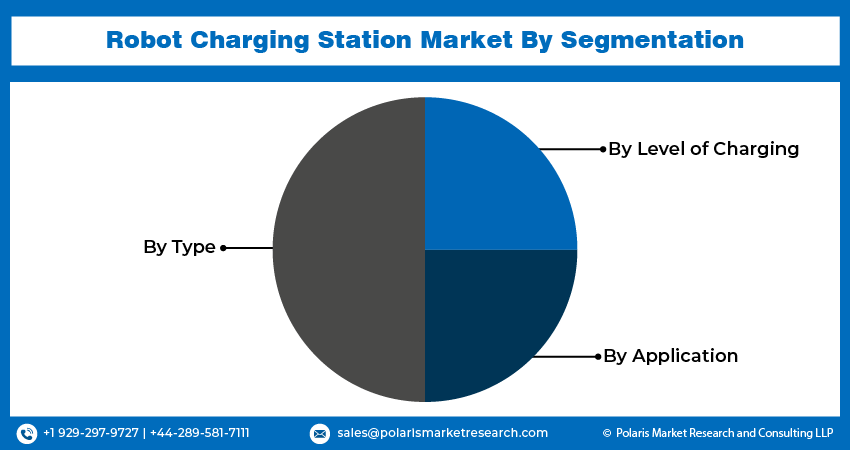
The Robot Charging Station Market report covering key segments are type, level of charging, application, and region.
Research Methodology
A robust system of research, verification, and forecasting designed to ensure reliable and actionable market insights.
Polaris Market Research & Consulting, Inc. uses a clear and structured approach to deliver insights that clients can rely on. The process combines detailed primary and secondary research, including direct communication with industry experts. The detailed information helps build a complete picture of market trends and developments. Secondary data is gathered from credible sources such as industry reports, company filings, government source links, and trusted organization databases. It is then cross-checked through discussions with key stakeholders across the value chain. Market size and forecasts are developed using both bottom-up and top-down methods to ensure accuracy and consistency in the final results.
1. Project Setup
Step 1 & 2:
- We start every project by clearly understanding the client’s objective or goal, then defining the market scope, and aligning regions, segments, and timelines.
- Once the foundation is set, we collect data from all-around of sources, including company reports, government databases, and paid industry platforms.
- Our research is based on secondary data, which helps us build a strong understanding of the market across regions and industries. Then we validate this information through primary research by speaking directly with industry experts, companies, and stakeholders.
- By combining secondary and primary research, we ensure that our market insights are accurate, practical, and closely aligned with real market conditions.
2. Data Collection
We gather information from both public and verified sources:
3. Data Structuring
Step 3:
- All collected data is organized into a consistent format to ensure accurate analysis. Since inputs come from multiple sources, they are standardized and aligned before use.
- The data is segmented by product, application, and region, and mapped across a defined historical period (2020–2024). All values are converted into common units (USD Mn/Bn), and volume and pricing are aligned where required to estimate revenue.
- Any overlaps or inconsistencies are reviewed and adjusted to maintain accuracy (<5% variance threshold).
- The result is a structured dataset that allows for clear comparison across regions and supports reliable analysis and forecasting.
Structured Market Dataset, USD Mn/Bn
| Region | Segment | VolumeUnits | Avg PriceUSD | RevenueUSD Mn | Share % |
|---|---|---|---|---|---|
| North America | Product A | 250 | 2.5 | 500 | 15% |
| Product A | XX | XX | XX | XX | |
| Product A | XX | XX | XX | XX | |
| Consistent methodology applied across regions | |||||
4. Market Estimation
Step 4: TOP-DOWN APPROACH
- We start with the overall market size at a global or macro level.
- The market is then narrowed down based on scope and industry relevance.
- We apply penetration rates and split the data by region and segment.
- This helps us estimate the market size for specific segments.
- The numbers are validated through cross-checks to ensure accuracy.
Step 5: BOTTOM-UP APPROACH
- We begin by analyzing data from leading companies in the market.
- Revenue data is collected and mapped across different segments.
- The data is then aggregated to estimate the total market size.
- To fill in any gaps, adjustments are made based on industry standards.
- Validation checks make sure that the results are correct.
5. Forecasting
Step 6:
At Polaris Market Research & Consulting, Inc., we employ a methodical forecasting strategy. This approach blends the analysis of historical data with real-time market validation. To forecast future trends with precision, we examine past patterns, pricing fluctuations, and the interplay of supply and demand. To ensure our conclusions reflect the present market landscape, we actively seek input from industry experts and key stakeholders.
To refine our predictions, we carefully consider critical elements such as market drivers and restraints, fluctuations in raw material costs, emerging technologies, and the production capabilities of various regions. Furthermore, we assess regulatory frameworks and potential policy shifts to gauge their potential impact on market expansion.
All this information is synthesized to generate precise forecasts for each segment and region. These forecasts illuminate the current state of the market and highlight forthcoming opportunities.
6. Validation & Triangulation
Step 7:
In the final stage, we validate all our estimates using a triangulation method, where data is cross-checked from multiple reliable sources, like company data, primary interviews, and secondary research. This helps us make sure that our numbers are correct and fit with the rest of the market.
This process involves verifying data consistency across various segments and geographic areas. It also requires comparing historical trends with the assumptions support the forecast. Any discrepancies involve adjustments to ensure everything remains aligned and dependable.
Once the data is finalized, we prepare the final outputs, including market size estimates, segment-wise breakdowns, and growth metrics. These are delivered in structured formats such as tables, charts, and data files for easy analysis and use.
We collaborate closely with clients, ensuring the final products align with their requirements. This includes offering tailored adjustments, supplementary data analyses, and continuous assistance. Furthermore, we monitor market trends post-delivery, providing updates and refinements to maintain the insights' relevance as time passes.
Triangulation Framework
Estimates are cross-verified across three sources:
Company-level data
• Primary inputs from industry participants
• Secondary benchmarks and published data
Variance maintained within +5-10%
Adjustments applied to align estimates
Segment values validated against overall market structure
Data Consistency & Integrity
Segment totals validated to 100%
Regional estimates aligned with global market size
Historical trends compared against forecast outputs
Assumptions reviewed for cross-segment and regional alignment
Final Outputs
Deliverables
Client Alignment & Support
- Deliverables are aligned with defined client requirements and scope
- Custom data cuts and segment splits are incorporated as required
- Post-delivery queries are addressed through analyst interactions
- Additional clarifications and data support are provided upon request
Client Continuity & Updates
- Market developments are tracked post-delivery to capture changes in key trends
- Updated data and revisions are provided based on new market inputs
- Additional refinements and data cuts are shared as required
- Continued analyst engagement supports evolving client requirements
Download Sample Report of Robot Charging Station Market
Please fill out the form to request a customized copy of the research report.
