
Sugar Substitutes Market Size, Growth Analysis Report, 2026 -2034
REPORT DETAILS
Sugar Substitutes Market Summary
The global sugar substitutes market was valued at USD 8.52 billion in 2025. The market is forecasted to grow at a CAGR of 5.5% from 2026 to 2034. Health-conscious consumers, diabetic population growth, and clean-label product formulations are driving continued market expansion.
Market Statistics
Key Takeaways
- North America led the global market with a 35.09% revenue share in 2025. The rising prevalence of health conditions such as diabetes and obesity has led to increased demand for sugar substitutes.
- Asia Pacific is projected to witness the fastest growth at a 6.10% CAGR. Rising urbanization and changing consumer dietary habits contribute to the regional market growth.
- The high-intensity sweeteners segment led with a 59.76% market share in 2025. The segment's dominance is attributed to the increased prevalence of noncommunicable diseases.
- The low-intensity sweeteners segment is expected to witness the fastest growth at a 6.50% CAGR. These sweeteners are widely used in various food products to reduce glycemic and obesity levels.
- The beverage segment held the largest market share of 45.30% in 2025. This is owing to the rising demand for calorie-free and no-added-sugar drinks.
Note: Figures and projections outlined in this report are the result of Polaris Market Research’s proprietary analytical processes, grounded in the latest available datasets and market observations.
Industry Dynamics
- The increased prevalence of obesity-linked diabetes diseases has resulted in higher demand for sugar substitutes.
- Regulatory measures like front-of-package warning labels are another factor fueling market development.
- Growing consumer preference for natural, plant-based sweetener alternatives is expected to present several market opportunities.
- Taste and sensory drawbacks may present market challenges.
AI Impact on Sugar Substitutes Market
- AI contributes to the development of new sugar substitutes by studying their flavors and textures.
- AI helps in product development by identifying trends of consumers for sugar-free products.
- AI supports quality control by maintaining consistency in the sweetness and food stability of products.
- AI helps in manufacturing by streamlining production and forecasting demand.
A sugar substitute is a dietary supplement that has a sweet taste similar to sugar but contains far fewer calories than sugar-based sweeteners. As a result, it is a calorie-free or low-calorie option. These substitutes are derived from natural sources or manufactured synthetically using chemicals and preservatives.
The sugar substitutes market is growing as consumer preferences inclination toward lower-calorie and healthier food options. Furthermore, the rising prevalence of lifestyle diseases such as cholesterol, diabetes, and cardiovascular issues associated with obesity is driving the growth of the market.
For instance, according to the International Food Information Council (IFIC), no/low-calorie sweeteners are preferred by 31% of Generation Z, 30% of millennials, and 23% of Generation X consumers. This trend is most likely influenced by a growing public awareness of the negative health effects of sugar consumption.
Source: Polaris Market Research Analysis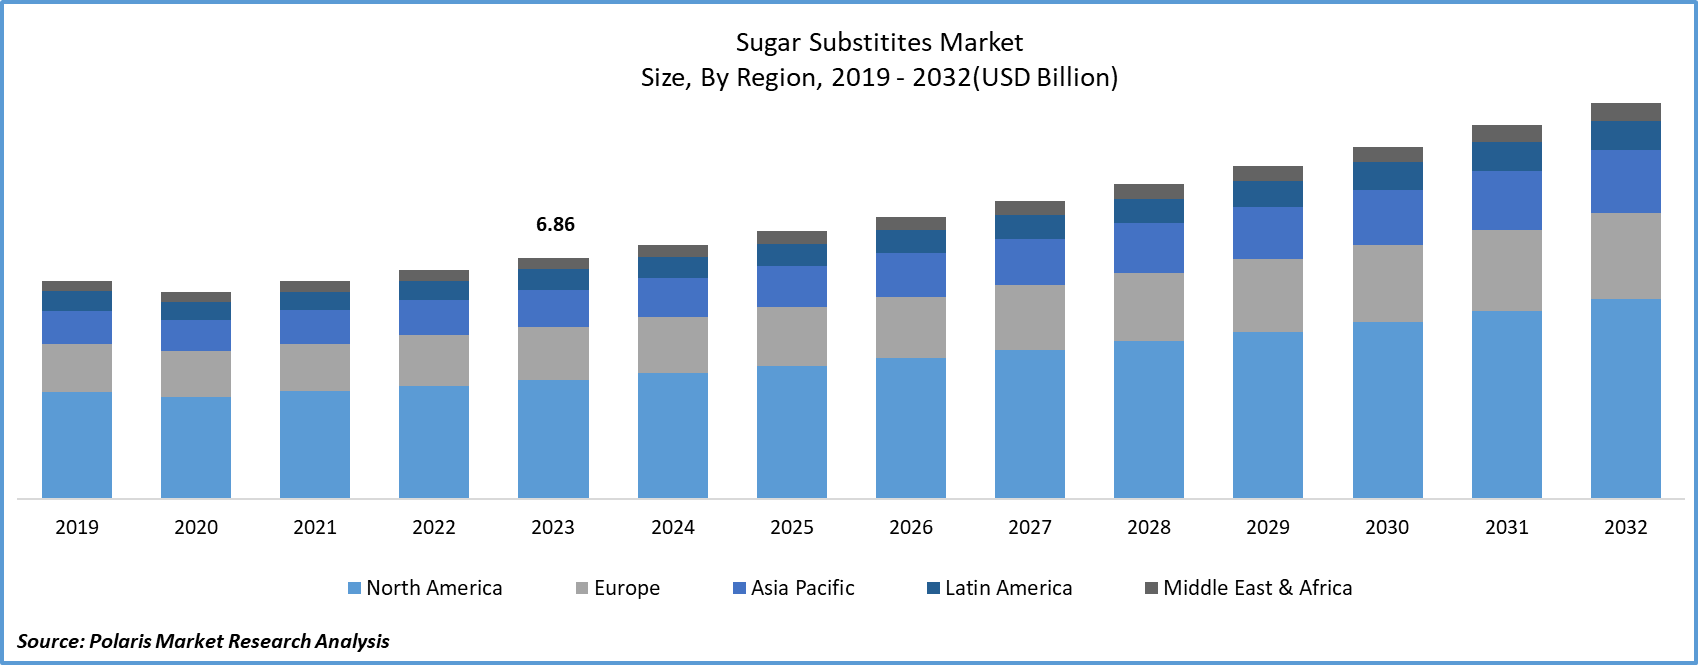
To Understand More About this Research: Download Sample Report
A sugar substitute is a low-calorie and non-nutritive alternative to sugar. Food manufacturers use it to provide consumers with healthier options in both food and beverages. While simulating the sweetening effect of sugar, this food additive contains fewer calories. Low-calorie sweeteners (LCS) deliver sweetness without the associated caloric content and have a higher sweetening potency per gram than sugar.
Consumers are increasingly inclined towards natural and plant-derived sweeteners as healthier alternatives to conventional sugar and artificial sweeteners. Because of their natural origins and low-calorie profiles, stevia, monk fruit, and erythritol are gaining popularity. Consumers are becoming more aware of the ingredients in their food and beverages, prompting them to prioritize sugar alternatives with clean labels, no artificial additives, and easily identifiable ingredients.
Sugar Substitutes vs Sugar
| Factor | Sugar Alternatives | Typical Sugar |
| Caloric Content | Less or no caloric content | High caloric content |
| Glycemic Index | Lower glycemic response | Increases blood sugar levels |
| Sweetness Level | More sweeter than sugar | Normal sweetness level |
| Amount Needed | Less amount is needed | More amount is needed |
| Nutritional Value | Employed in diet foods | Employed in obesity-related foods |
| Application Areas | Specialized foods | Regular foods |
Source: Polaris Market Research Analysis
Source: Polaris Market Research Analysis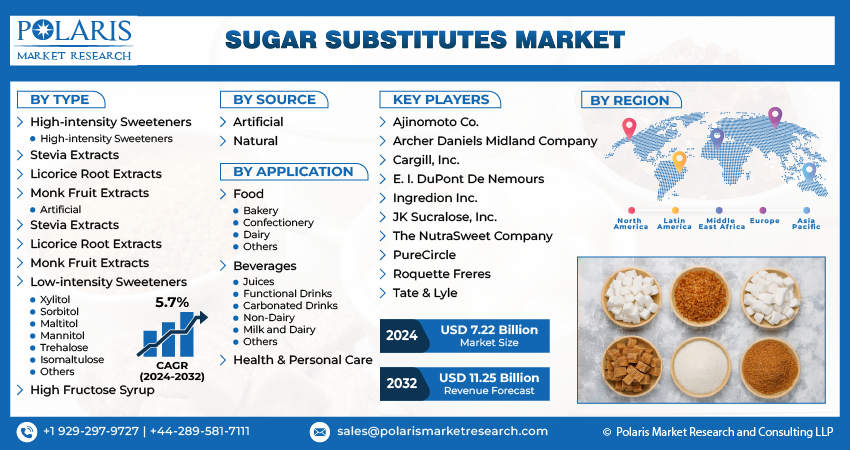
Industry Dynamics
Growth Drivers
Increasing Prevalence of Obesity-Linked Lifestyle Diseases like Cardiovascular Diseases, Diabetes, and Cholesterol Will Drive the Growth of the Market
The rising prevalence of obesity-linked lifestyle diseases such as cardiovascular diseases, diabetes, and cholesterol will drive the market growth. As people's living standards and economic progress improve, there is a growing trend in the popularity of functional nutrition and food additives, particularly sugar substitutes. These substitutes add sweetness and flavor to food without adding extra calories. The American Diabetes Association and the American Heart Association both support artificial sweeteners as a viable substitute for sugar, aiming to reduce the risks associated with obesity, metabolic disorders, diabetes, and heart disease while also assisting individuals in calorie management.
Increased fat consumption, decreased physical activity, and excessive sugary food consumption are fueling the global obesity epidemic. This widespread health problem, a major contributor to type 2 diabetes, is expected to worsen globally by 2030. The growing preference for healthier dietary options has resulted in the widespread adoption of low-calorie diets. Artificial sweeteners, which are 200 times sweeter than sugar, are gaining popularity in the food and beverage industries, particularly among those suffering from diabetes and obesity. This is anticipated to drive the growth of the sugar substitutes market.
Regulatory Compliance and Safety Standards
Sugar substitutes are controlled by strict food safety laws to ensure that they are safe for consumption in food and beverages. The FDA, EFSA, and similar organizations issue guidelines for consumption levels, labeling, ingredients approval processes, and production processes for products. Products must be tested thoroughly before being released into the market in terms of safety, stability, and health implications. This process guarantees high-quality products and is also vital in international business transactions and consumer confidence.
Report Segmentation
The market is primarily segmented based on type, source, application, and region.
| By Type | By Source | By Application | By Region |
|
|
|
|
Source: Polaris Market Research Analysis
To Understand the Scope of this Report: Request Customization
By Type Analysis
The High-Intensity Sweeteners Segment Accounted for the Largest Revenue Share in 2025
In 2025, the high-intensity sweeteners segment held the largest revenue share of 59.76%. The rising prevalence of noncommunicable diseases, the growing desire for low-calorie sweeteners, the various health benefits provided by sugar substitutes, and a renewed emphasis on natural and environmentally friendly alternatives to traditional sugar are all significant trends. The global trend toward health and wellness is anticipated to accelerate the adoption of high-intensity sweetness in the coming years.
On the other hand, the low-intensity sweeteners segment is expected to witness fastest growth of CAGR 6.50% during the forecast period. Many low-intensity sweeteners do not contribute to tooth decay because they do not produce enamel-damaging acids like sugar. Sweeteners with beneficial properties include erythritol, xylitol, mannitol, and sorbitol. These sweeteners are incorporated into a variety of food products to reduce glycemic and obesity levels, contributing to the fastest growth in this segment.
By Application Analysis
The Beverage Segment Accounted for the Highest Market Share in 2025
The beverage segment held the highest market share of 45.30% in 2025, owing to the rising demand for calorie-free and no added sugar drinks amidst the population. Sugar substitutes such as stevia and neotame are continually used in low-calorie meals and beverages. Neotame has a sweetness that is 7,000 to 13,000 times that of sugar, whereas stevia is 200 to 300 times sweeter. Stevia is commonly found in a variety of food and beverage products, including teas and juices. Companies such as Cargill, ED&F Man/Unavoo Food Technologies Ltd., and Tate & Lyle have devised natural sugar substitutes with improved sweetness levels that are specially designed for use in beverages. Iced tea, soft drinks, energy drinks, flavored water, chocolate milk, and soft drinks all use these substitutes.
On the other hand, health and personal care are anticipated to witness fastest growth during the forecast period. Sugar substitutes are becoming more common in a variety of food categories as consumer preferences and understanding of low-calorie food options and dairy products evolve. This shift benefits many products, including soft drinks, powdered drink mixes, baked goods, and canned foods. Non-nutritive sweeteners are increasingly employed to enhance the sweetness of these items, replacing traditional sugars like corn syrup, agave nectar, honey, and sucrose. The benefit is that these sweeteners, which are naturally sweeter than sugar, can be used in smaller amounts to attain desired sweetness levels.
Source: Polaris Market Research Analysis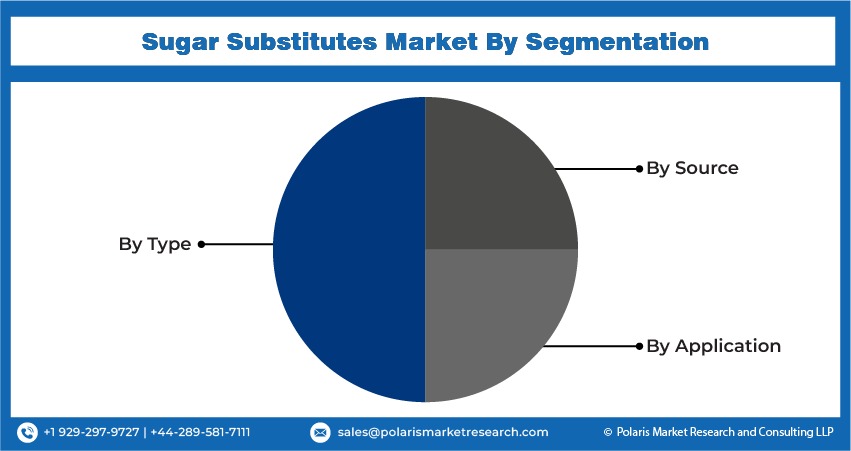
Regional Insights
North America Accounted for the Largest Market Share of 35.09% in 2025
In 2025, North America held the largest market share in the sugar substitutes market. The rising demand for sugar substitutes in the region is being driven by the prevalence of obesity, diabetes, and other health problems associated with excessive sugar consumption. The United States is the primary market for sugar substitutes in North America, with the largest market share. Rising health consciousness among North American consumers has increased their preference for low-calorie food and beverage options, propelling the region's sugar substitute market forward. Primarily, sugar substitutes are in high demand in the soft drink and confectionery industries. To meet the growing demand for healthier options, many regional food and beverage companies are incorporating sugar substitutes into their products.
Asia Pacific is accounted for the fastest growth of CAGR 6.10%, owing to the changing dietary habits of consumers and the rising urbanization. China and India appear as crucial markets in the region, fueled by rising health concerns and an increase in disposable incomes, which fuels the desire for low-calorie and natural food items. The growing health consciousness among consumers, combined with a growing preference for healthier alternatives to conventional sugar, are the primary drivers driving the growth of the sugar substitutes market in the Asia Pacific.
Source: Polaris Market Research Analysis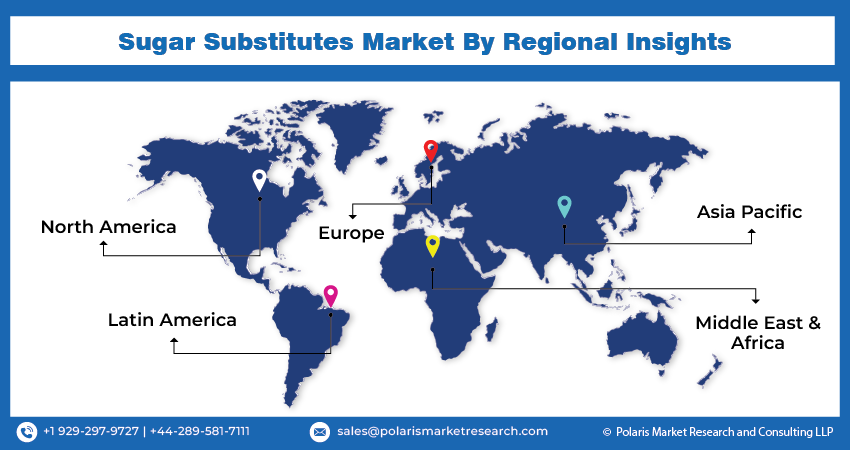
Key Market Players & Competitive Insights
The market is characterized by intense competition, with established players relying on advanced technology, high-quality products, and a strong brand image to drive revenue growth. These companies employ various strategies such as research and development, mergers and acquisitions, and technological innovations to expand their product portfolios and maintain a competitive edge in the market.
Some of the major players operating in the global market include:
- Ajinomoto Co.
- Archer Daniels Midland Company (ADM)
- Cargill, Inc.
- E. I. DuPont De Nemours
- Ingredion Inc.
- JK Sucralose, Inc.
- The NutraSweet Company
- PureCircle
- Roquette Freres
- Tate & Lyle
Recent Developments
- February 2026: Tate & Lyle PLC and Manus introduced the Yume brand as part of The Sweetener Alliance. The Yume M Stevia Sweetener is the first product launched as part of the Yume brand range. The Yume M Stevia Sweetener is a Reb M solution that gives consumers an improved taste experience similar to sugar but without the bitterness associated with older plant-based sweeteners. (source: tateandlyle.com).
Sugar Substitutes Market Report Scope
| Report Attributes | Details |
| Market size value in 2025 | USD 8.52 billion |
| Market size value in 2026 | USD 8.89 billion |
| Revenue forecast in 2034 | USD 13.79 billion |
| CAGR | 5.50% from 2026 – 2034 |
| Base year | 2025 |
| Historical data | 2021 – 2024 |
| Forecast period | 2026 – 2034 |
| Quantitative units | Revenue in USD billion and CAGR from 2026 to 2034 |
| Segments Covered | By Type, By Source, By Application, By Region |
| Regional scope | North America, Europe, Asia Pacific, Latin America, Middle East & Africa |
| Customization | Report customization as per your requirements with respect to countries, region, and segmentation |
Source: Polaris Market Research Analysis
FAQ's
The global sugar substitutes market size is expected to reach USD 13.79 billion by 2034
Key players in the market are Ajinomoto Co., Archer Daniels Midland Company (ADM), Cargill, Inc., E. I. DuPont De Nemours, Ingredion Inc
North America contribute notably towards the global sugar substitutes market with 35.09% share.
The global sugar substitutes market is expected to grow at a CAGR of 5.50% during the forecast period.
The sugar substitutes market report covering key segments are type, source, application and region.
Download Sample Report of Sugar Substitutes Market
Please fill out the form to request a customized copy of the research report.
